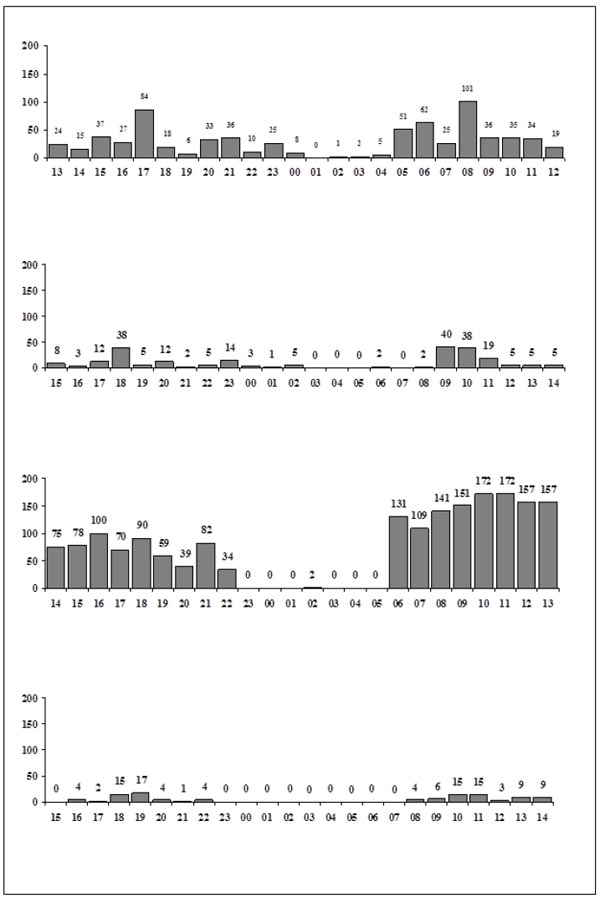
Fig. (1)
Twenty four hour cough recordings for both the patients before and after treatment with ivacaftor are depicted. Numbers of coughs recorded in an hour are shown on the “y” axis and the “x” axis demonstrates time in a 24 hour format. The top most panel is a cough recording for the first patient before treatment and the panel below that is on treatment with ivacaftor. The subsequent two panels similarly show the 24 hour cough recording for the second patient prior to (3rd panel from top) and on treatment (the last panel) with ivacaftor.

