Fig. (1)
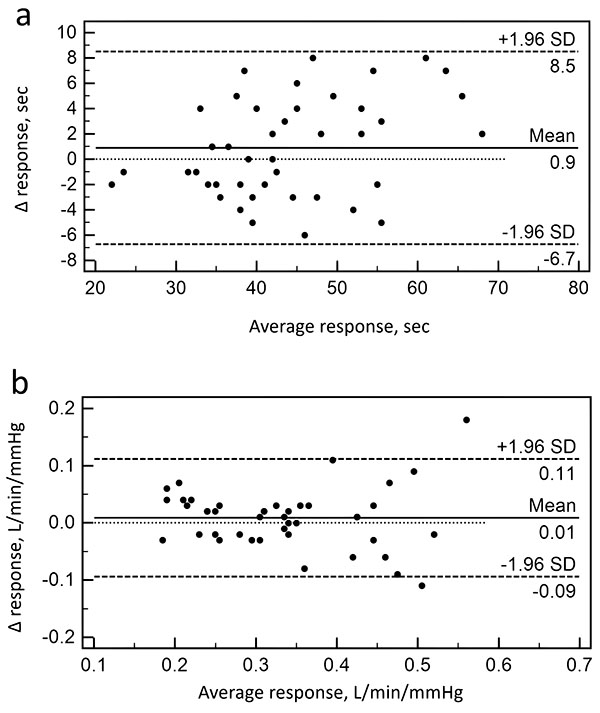
Bland–Altman plot of the difference between the results of two BHT (a) and two SB-CO
2
test (b) against their average.