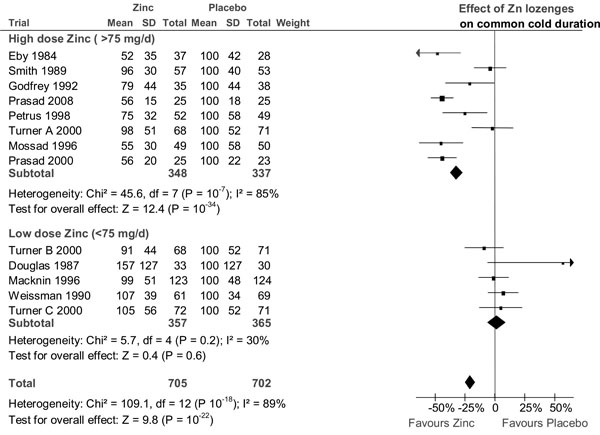
Fig. (1) The effect of zinc lozenges on the duration of the common cold. The trials are in the same order as in Table 1, from the highest daily dose of zinc to the lowest dose. They are divided into the same high dose and low dose subgroups as in Table 2. In the forest plot on the right side, the vertical line indicates the placebo level. The horizontal line indicates the 95% CI for the effect and the square in the middle of the horizontal line indicates the point estimate of the effect in the particular trial. Three diamond shapes indicate the pooled effects and their 95% CI:s for the two subgroups and for all trials. The duration of colds has been transformed to the relative scale so that the duration in the placebo group is given the value of 100%. Thereby the difference between zinc and placebo groups directly indicates the effect of zinc lozenges in percentages. See Supplementary Material 2 and Supplementary Material 3 for the extraction of the data and for the calculation of the relative mean and SD values for the common cold duration.