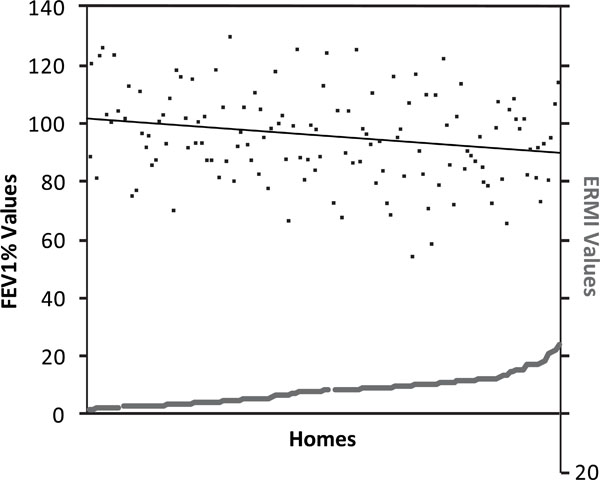
Fig. (1) The paired Environmental Relative Moldiness Index
(ERMI) value in each asthmatic child’s home (gray squares, z-axis)
and the child’s “forced expiratory volume in 1 second percentage”
(FEV1%) value (black dots, y-axis). The regression line for FEV1%
shows a downward slope as the homes’ ERMI values increased.