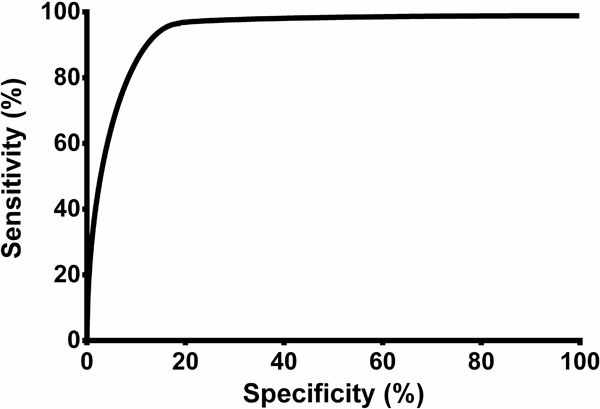
Fig. (1) Curve of the sensitivity and specificity of pleural cholesterol. In a Receiver Operating Characteristic (ROC) curve, the true positive rate (sensitivity) is plotted as a function of the false positive rate (specificity) for the different cut-off points. Each point on the ROC curve represents a sensitivity/specificity pair that corresponds to a particular decision threshold. A test with perfect discrimination (no overlap between the two distributions) has a ROC curve that passes through the upper left corner (100‰ sensitivity and 100‰ specificity). Therefore, the closer the ROC curve is to the upper left corner, the higher the overall accuracy of the test. This ROC curve has an area of 0.871 (SD 0.027), a confidence interval of 95‰ (0.819-0.923), and p< 0.0001.