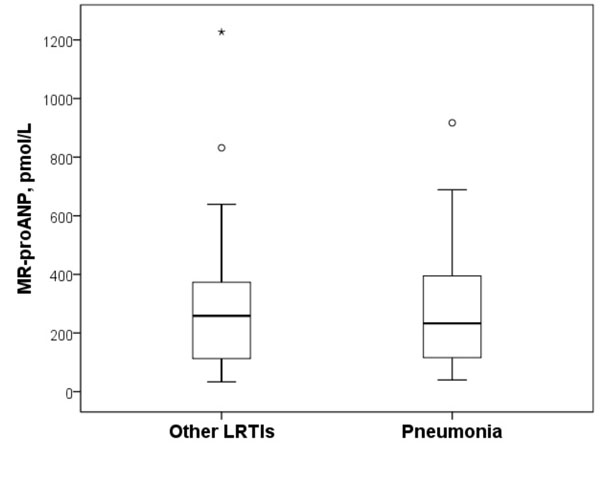
Fig. (1) Box plots of the MR-proANP plasma levels in the study population. The patients
with pneumonia had similar MR-proANP levels (median 233 pmol/L [IQR 25-75,
115-398 pmol/L]) compared with those with other LRTIs (median 259 pmol/L
[110-399 pmol/L]) (p=0.88). The Box plots represent the 25th and 75th
percentiles, with the internal horizontal lines showing the median. T-shaped
bars represent the 10th and 90th percentiles. IQR,
interquartile range; MR-proANP, mid-regional proatrial natriuretic peptide.