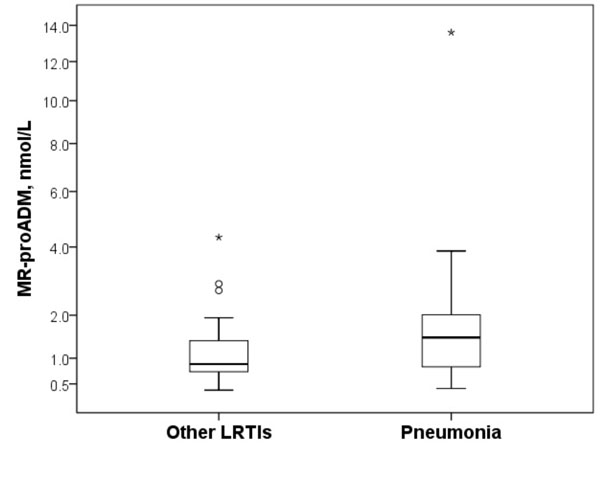
Fig. (2) Box plots of the MR-proADM plasma levels in the study population. The patients
with pneumonia had increased MR-proADM levels (median 1.46 nmol/L [IQR 25-75,
0.82-2.02 nmol/mL]) compared with those with other LRTIs (median 0.88 nmol/L
[0.71-1.39 nmol/L]) (p=0.04). The MR-proADM units are expressed as natural
logarithm. The box plots represent the 25th and 75th
percentiles, with the internal horizontal lines showing the median. T-shaped
bars represent the 10th and 90th percentiles. IQR,
interquartile range; MR-proADM, mid-regional proadrenomedullin.