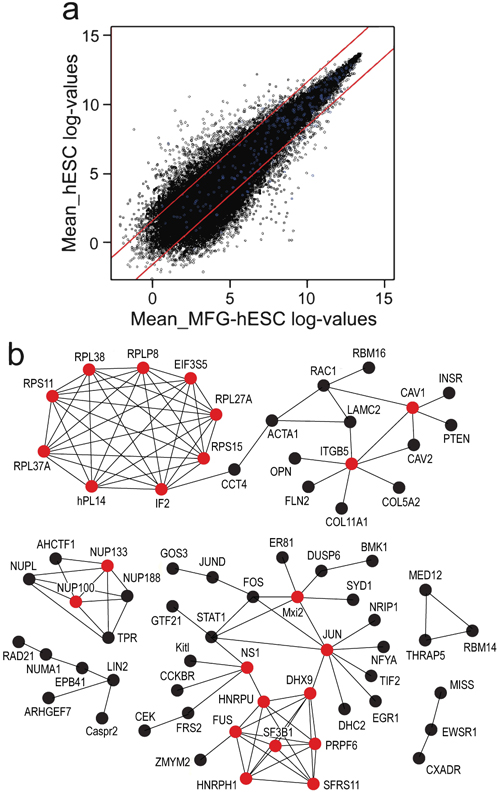
Fig. (2)
Scatter plot (a) where genes within the red lines indicate a FC of less than ±3 and blue dots indicate genes characteristic of feeder-cultured hESCs (also shown in Table 1 and MFG-hESCs. Hub protein network of genes overexpressed (b) and underexpressed (c) in MFG-hESCs compared to feeder-cultured hESCs with a FC ≥3. Proteins are identified as hubs if they have at least five experimentally determined protein interactions among the products of the up-regulated genes. Red circle = hub protein. Abbreviations: FC, fold change; hESCs, human embryonic stem cells; MFG-hESCs, matrix-free growth adapted human embryonic stem cells.