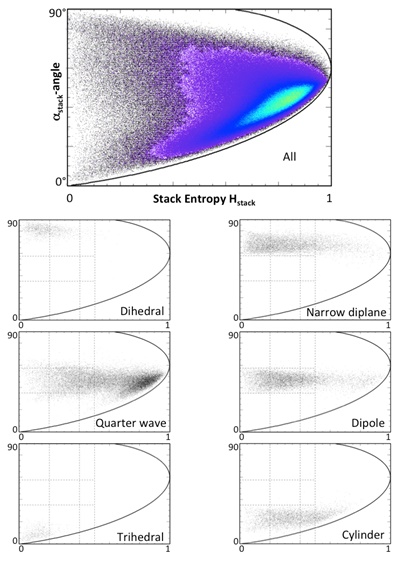
Fig. (3)
H
stack
/α
stack
density scatter plot of the Montreal data stack (black=low density to yellow=high densitly; top image). Cameron stack results with a 70% confidence threshold are plotted in the H
stack
/α
stack
space (rest).