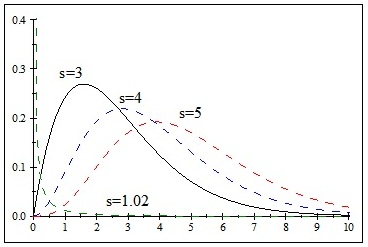
Fig. (1)
Graph of the pdf (3) for r=α=β=1 and for various values of s (for s=3 this is model 1).