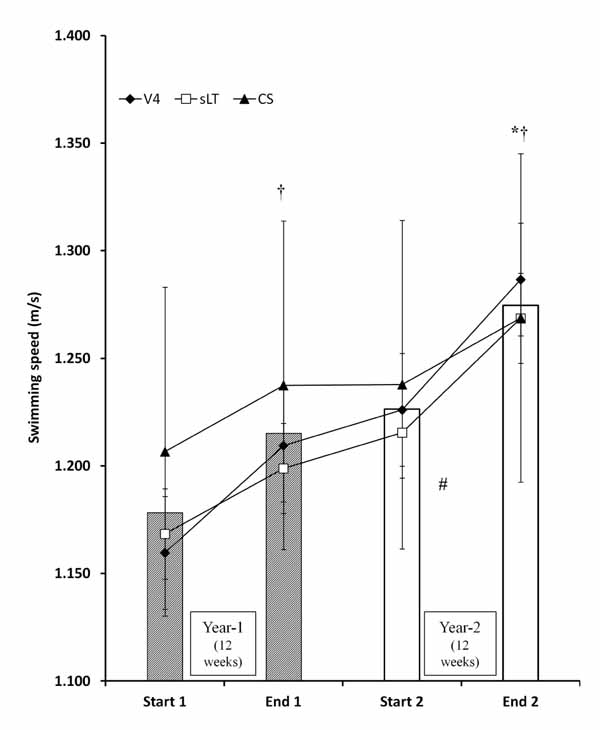
Fig. (2)
Changes in speed corresponding to blood lactate concentration of 4 mmol.L-1 (V4), speed at lactate threshold (sLT) and critical speed (CS) in year-1 (start-1, end-1) and year-2 (start-2, end-2) at the corresponding 12-week specific preparation mesocycles. The bars indicate the average value of all three indices combined. *: V4 start-2 vs. end-2, p<0.05; #: year-2 vs. year-1, p<0.05; †: start vs. end in both years, p<0.05.