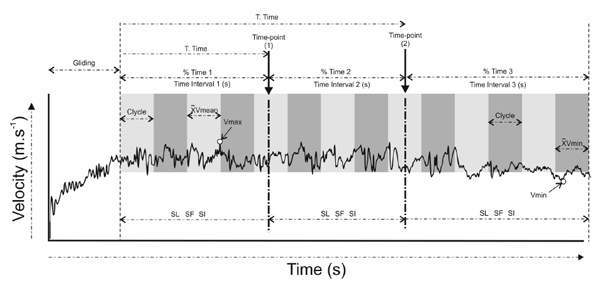
Fig. (1)
Representative schema of speed variation during a 25m manikin carry race. Each upper limb cycle is representing by different shaded areas. The exact points of speed variation change are representing by the 2nd and 3rd vertical lines (threshold 1 and threshold 2), and the first and last vertical lines represent the starting and ending time-points of data analysis.