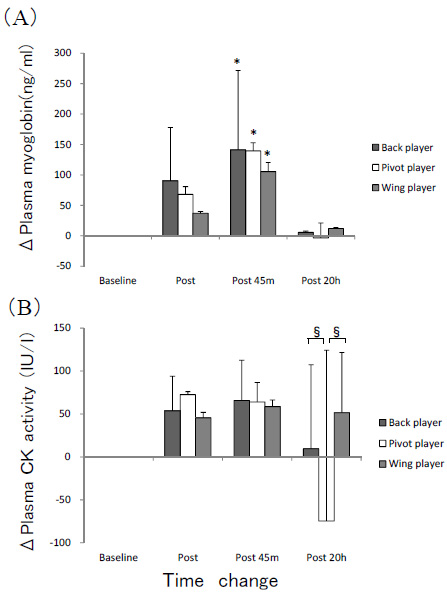
Fig. (5) Amount of changes in plasma myoglobin concentration (A) and plasma CK activity (B) in different play position before and after the Game II. Difference versus Baseline indicate *:p<0.05, Difference between each play position indicate §:p<0.05.