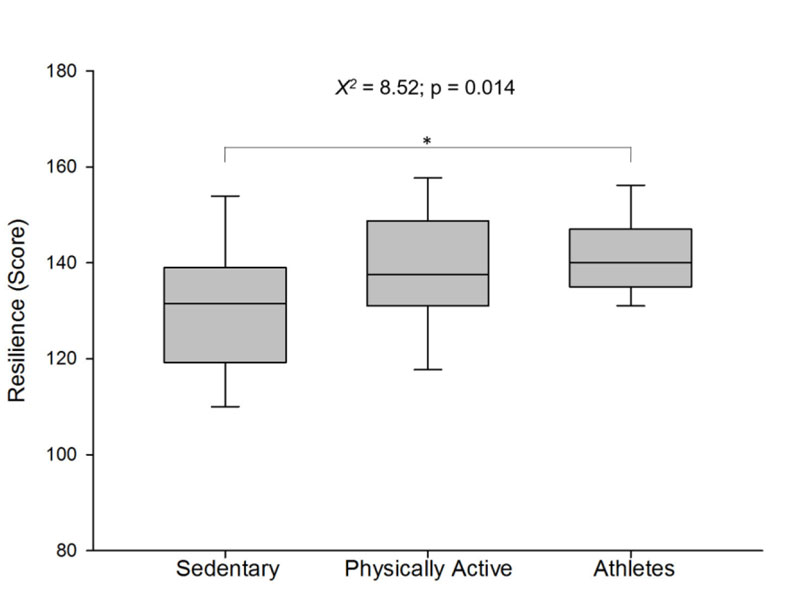
Fig. (1)
The resilience score of investigated groups. Values are presented as median, first and third quartiles (box). *significant difference (p≤0.05) between sedentary and athlete groups.