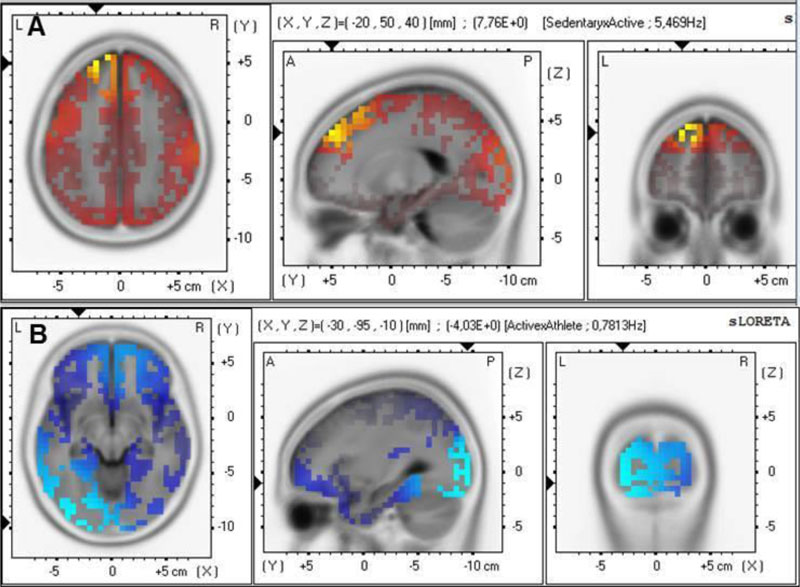
Fig. (4) sLORETA analyses for (A) sedentary and physically active and for (B) physically active and athlete groups. (A) Red and yellow colors represent the higher activity (p≤0.05) observed for the sedentary group (theta activity) shown in the BA 9. (B) Light and dark blue colors represent the lower activity (p≤0.05) observed for the physically active group (delta activity) shown in the BA 18. For X (-represents left, +represents right), Y (-represents posterior, +represents anterior), Z (-represents inferior, +represents superior).