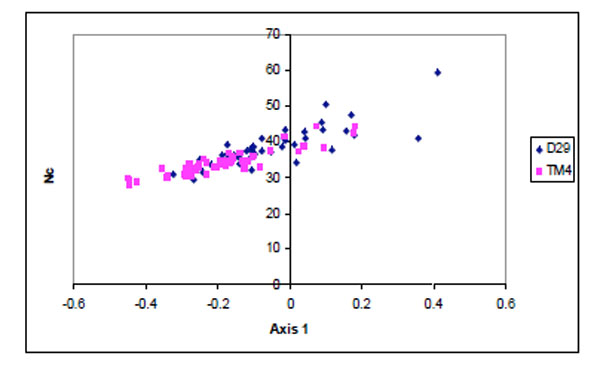
Fig. (3)
Scatter plot of the genes of D29 (blue) and TM4 (pink)against Nc values.