|
Traffic Scenario |
Fuel Consumption and Pollutant Emission Rate | ||||||||||||||
|
Fuel Consumption (l) |
CO2 (g/km) |
NOX (g/km) |
PM (g/km) |
VOC (g/km) |
|||||||||||
| (NBL) | (CBL) | (MBL) | (NBL) | (CBL) | (MBL) | (NBL) | (CBL) | (MBL) | (NBL) | (CBL) | (MBL) | (NBL) | (CBL) | (MBL) | |
| Scenario 1 | 3,195.66 | 3,058.63 | 3,025.40 | 7,466,825.84 | 7,335,318.35 | 7,219,963.02 | 23,355.96 | 22,924.91 | 22,617.88 | 3,744.00 | 3,565.90 | 3,505.60 | 3,854.78 | 3,833.94 | 3,823.66 |
| %Diff.* | 4.29% | 5.33% | 1.76% | 3.31% | 1.85% | 3.16% | 4.76% | 6.37% | 0.54% | 0.81% | |||||
| Scenario 2 | 3,195.66 | 2,723.97 | 2,730.54 | 7,466,825.84 | 6,552,181.03 | 6,503,285.82 | 23,355.96 | 20,578.94 | 20,309.76 | 3,744.00 | 3,150.05 | 3,138.24 | 3,854.78 | 3,425.66 | 3,439.11 |
| %Diff.* | 14.76% | 14.55% | 12.25% | 12.90% | 11.89% | 13.04% | 15.86% | 16.18% | 11.13% | 10.78% | |||||
| Scenario 3 | 3,195.66 | 2,429.60 | 2,450.71 | 7,466,825.84 | 5,840,660.79 | 5,827,160.92 | 23,355.96 | 18,293.23 | 18,231.72 | 3,744.00 | 2,802.15 | 2,844.52 | 3,854.78 | 3,077.81 | 3,059.35 |
| %Diff.* | 23.97% | 23.31% | 21.78% | 21.96% | 21.68% | 21.94% | 25.16% | 24.02% | 20.16% | 20.63% | |||||
| Scenario 4 | 3,195.66 | 2,143.41 | 2,166.64 | 7,466,825.84 | 5,146,902.28 | 5,145,879.81 | 23,355.96 | 16,168.16 | 16,073.42 | 3,744.00 | 2,475.89 | 2,520.34 | 3,854.78 | 2,705.87 | 2,699.65 |
| %Diff.* | 32.93% | 32.20% | 31.07% | 31.08% | 30.78% | 31.18% | 33.87% | 32.68% | 29.80% | 29.97% | |||||
| Scenario 5 | 3,195.66 | 1,844.39 | 1,872.00 | 7,466,825.84 | 4,426,682.50 | 4,444,426.41 | 23,355.96 | 13,866.09 | 13,883.61 | 3,744.00 | 2,127.10 | 2,181.14 | 3,854.78 | 2,341.81 | 2,329.94 |
| %Diff.* | 42.28% | 41.42% | 40.72% | 40.48% | 40.63% | 40.56% | 43.19% | 41.74% | 39.25% | 39.56% | |||||
| Scenario 6 | 3,195.66 | 1,551.51 | 1,587.40 | 7,466,825.84 | 3,722,692.32 | 3,756,228.49 | 23,355.96 | 11,654.81 | 11,695.26 | 3,744.00 | 1,786.65 | 1,847.67 | 3,854.78 | 1,975.98 | 1,967.61 |
| %Diff.* | 51.45% | 50.33% | 50.14% | 49.69% | 50.10% | 49.93% | 52.28% | 50.65% | 48.74% | 48.96% | |||||
Note: Diff.* difference value of result between:
§ Non-Bike Lanes (NBL) CAR and Conventional Bike Lanes (CBL) CAR calculated as:
Diff.*(CBL)CAR =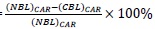
§ Non-Bike Lanes (NBL) CAR and Median Bike Lanes (MBL) CAR calculated as:
Diff.*(MBL)CAR =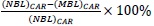
§ Non-Bike Lanes (NBL) CAR and Conventional Bike Lanes (CBL) CAR calculated as:
Diff.*(CBL)CAR =
§ Non-Bike Lanes (NBL) CAR and Median Bike Lanes (MBL) CAR calculated as:
Diff.*(MBL)CAR =