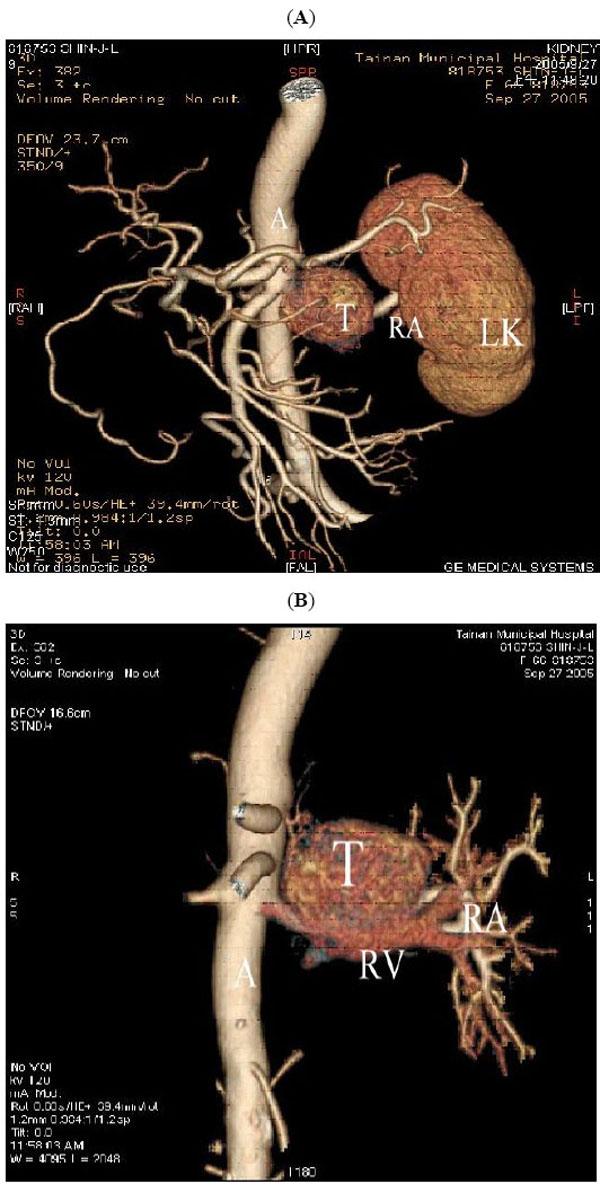
Fig. (3)
(A)
and
(B)
64-slice CT with 3D reconstruction, showing the tumor mass (T) seen between renal artery (RA) and renal vein (RV). (A represents aorta and LK represents left kidney).