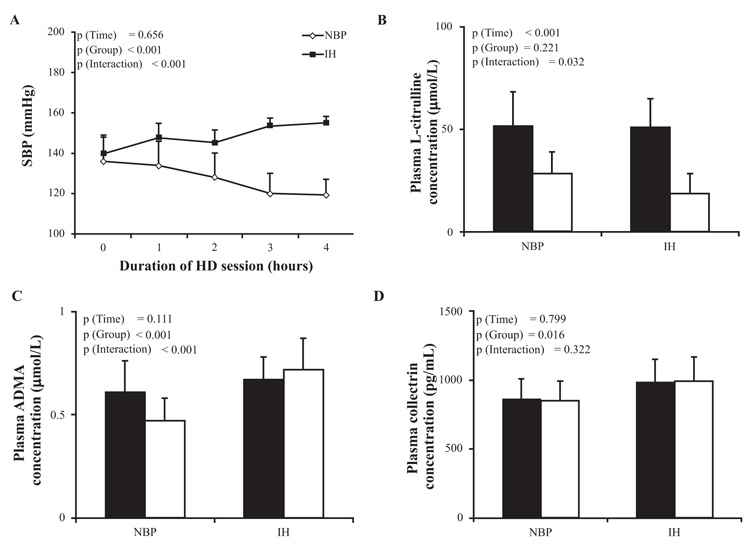
Fig. (1) Patterns of mean intradialytic SBP and the endothelium NO balance assessed by circulating biomarkers concentrations of L-citrulline, ADMA and collectrin for NBP and IH groups. (A) Mean SBP before, during and after the session for all the HD sessions. Pre- (Black box) and post-dialysis (White box) plasma concentrations of L-citrulline (B), ADMA (C) and collectrin (D). Data were represented as mean ± SD. All the p-values are derived from the MANOVA model. 3 types of p values are presented: p (Time) associated with the within subject effect (time factor, 2 levels, pre and post dialysis), p (Group) associated with the between subject’s effect (Group factor, 2 levels, IH and NBP group), and the p (Interaction) associated with the group*time interaction term.