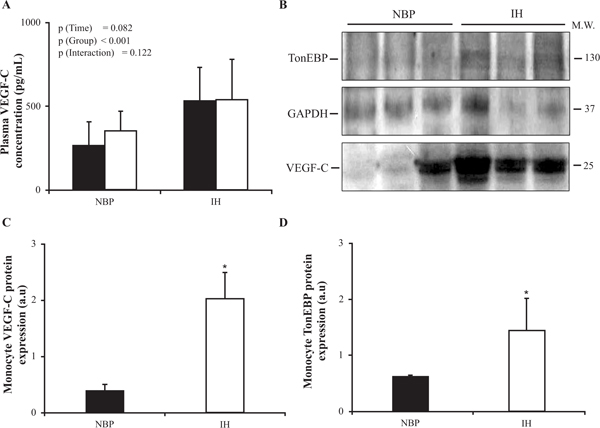
Fig. (2) Overexpression of VEGF-C and TonEBP in IH patient monocyte cells. (A) Plasma VEGF-C concentration (pg/mL) dosage in pre-(Black box) and post-dialysis (White box) samples of NBP and IH groups (p-values are derived from the MANOVA model. 3 types of p values are presented: p (Time) associated with the within subject effect (Time factor, 2 levels, pre and post dialysis), p (Group) associated with the between subjects effect (Group factor, 2 levels, IH and NBP group), and the p (Interaction) associated with the group*time interaction term). Representative western blot figures (B) and quantifications of VEGF-C (C) and TonEBP (D) in human monocytes of NBP (Black box) and IH (White box) groups, normalized to GAPDH whereas GAPDH is used as an internal control (in arbitrary units, a.u.). Three western blots for each protein (9 NBP patients and 9 IH patients) (* p<0.05 vs NBP). Data are represented as means ± SD. The latter comparison between NBP and IH groups was performed with the Student’s t test.