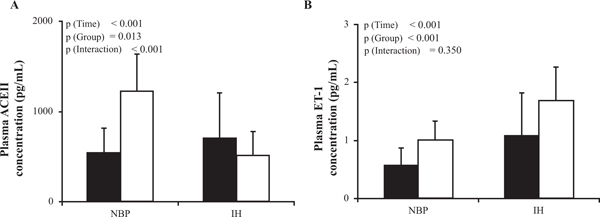
Fig. (3) Lower plasma concentration of ACE II in IH group. (A) Measurement of plasma concentration of ACE II (pg/mL) in pre- (Black box) and post-dialysis (White box) for NBP and IH groups. Plasma ET-1 concentration (B) (pg/mL) dosage in pre- (Black box) and post-dialysis (White box) samples of NBP and IH groups. Data are represented as means ± SD. Comparison between NBP and IH groups was performed with the two-way MANOVA for repeated measures, 3 types of p values are presented: p (Time) associated with the within subject effect (Time factor, 2 levels, pre and post-dialysis), p (Group) associated with the between subjects effect (Group factor, 2 levels, IH and NBP groups), and the p (Interaction) associated with the group*time interaction term.