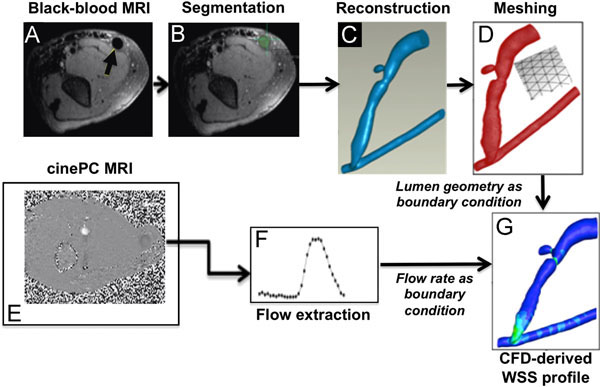
Fig. (2) Magnetic resonance imaging (MRI)-to-computational fluid dynamics (CFD) pipeline. The pipeline to obtain the blood vessel
lumen geometry serving as the structural boundary for CFD is shown in Panels A-D. Panels E-F show the pipeline for extracting blood flow
rates to be used as CFD flow boundary conditions. (A) Contrast-free black-blood MRI was performed to image lumen geometry. An example
DICOM image shows an axial cross-section of the arm (arrow indicates the lumen of an AVF vein). (B) Segmentation of the AVF vein and
artery was performed on the same example DICOM image (AVF vein lumen filled green). (C) The segmented lumen from several slices
resulted in a 3D reconstruction and (D) were meshed volumetrically. (E) Contrast-free cine phase-contrast MRI was performed over a
cardiac cycle over a forearm AVF, and (F) blood flow rates during the cardiac cycle were extracted from the MRI data. (G) A CFD-derived
wall shear stress (WSS) profile where the feeding artery is the vessel on the bottom and the fistula vein is the curved vessel branching off of
the feeding artery. Reprinted from Journal of Biomechanics, Y He, C Terry, C Nguyen, S Berceli, Y Shiu, A Cheung, "Serial analysis of
lumen geometry and hemodynamics in human arteriovenous fistula for hemodialysis using magnetic resonance imaging and computational
fluid dynamics," 46:165-169. Copyright (2013), with permission from Elsevier [46].