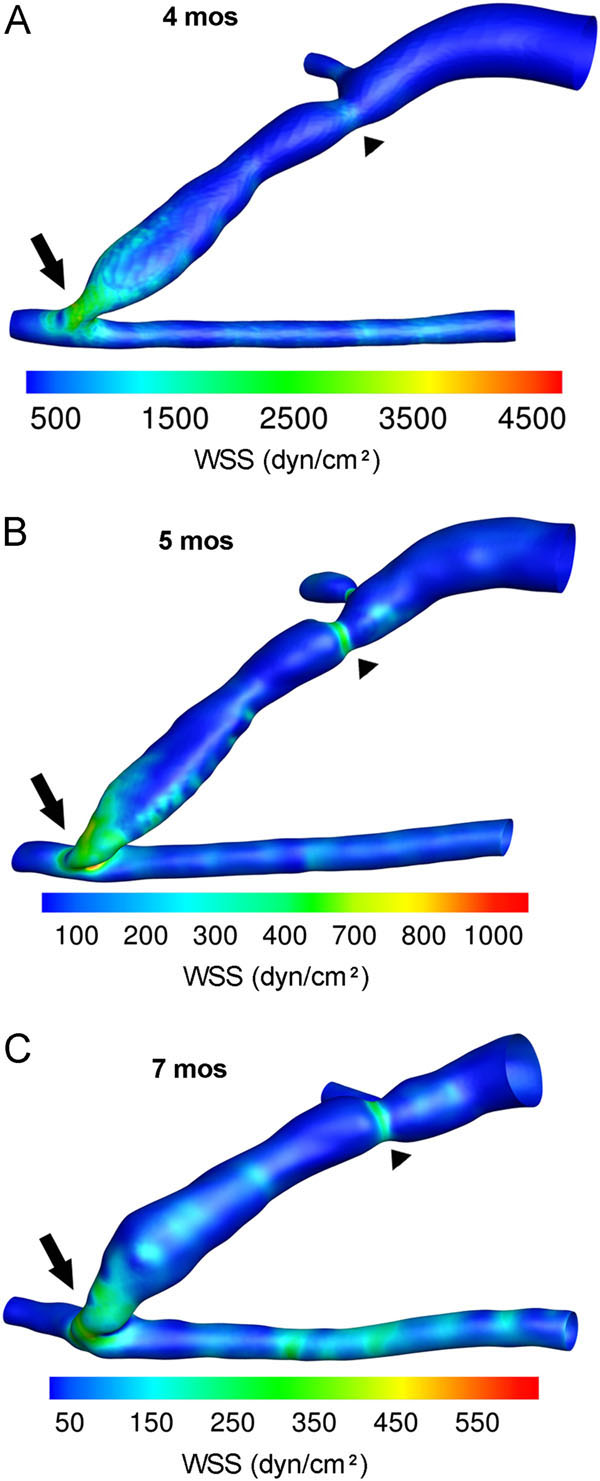
Fig. (3) WSS profiles in an AVF of a hemodialysis patient.
Contour plots of the WSS values averaged over a cardiac cycle for
MRI scans at (A) 4, (B) 5, and (C) 7 months (mos) after AVF
creation. The highest WSS values were found at the anastomosis
(arrow) and the region of stenosis (arrowhead) of the AVF vein at
all 3 time points. However, AVF WSS decreased from 4 to 7 mos.
Note that the color scale bar was adjusted for peak WSS at each
time point and the anastomosis and artery were maintained at the
same angle of view for all 3 time points. However, the AVF vein
deformed over time, obscuring the view of the accessory vein at
7 mos. In these images, the feeding artery is to the right of the
anastomosis, the distal artery is to the left of the anastomosis, and
the fistula vein is branching off of the artery at the anastomosis and
the accessory vein branching off of the fistula vein just above the
stenosis. Reprinted from Journal of Biomechanics, Y He, C Terry,
C Nguyen, S Berceli, Y Shiu, A Cheung, "Serial analysis of lumen
geometry and hemodynamics in human arteriovenous fistula for
hemodialysis using magnetic resonance imaging and computational
fluid dynamics," 46:165-169. Copyright (2013), with permission
from Elsevier [46].