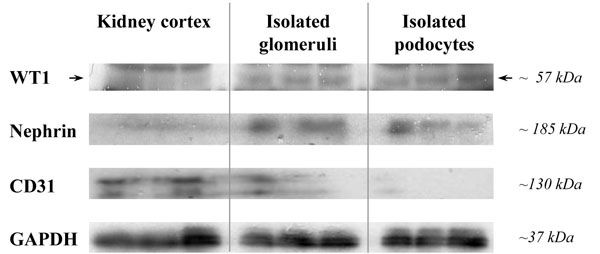
Fig. (11)
Western-blot detection of the podocyte marker proteins
WT1 and nephrin, the endothelial marker protein CD31, and of GAPDH (loading
control). Per lane, 10 μg of protein, isolated from total renal cortical
tissue, from isolated glomeruli, and from isolated podocytes were loaded.
Samples were pooled from each two mice (n=6). Molecular weights of protein
bands are indicated. Samples of isolated glomeruli and isolated podocytes show
intenser WT1 bands (arrows) and nephrin-bands, as compared to total renal
cortical tissue samples. In samples of isolated podocytes, the intensities of
bands referring to CD31 are weaker, as compared to samples from isolated
glomeruli and total kidney cortex.