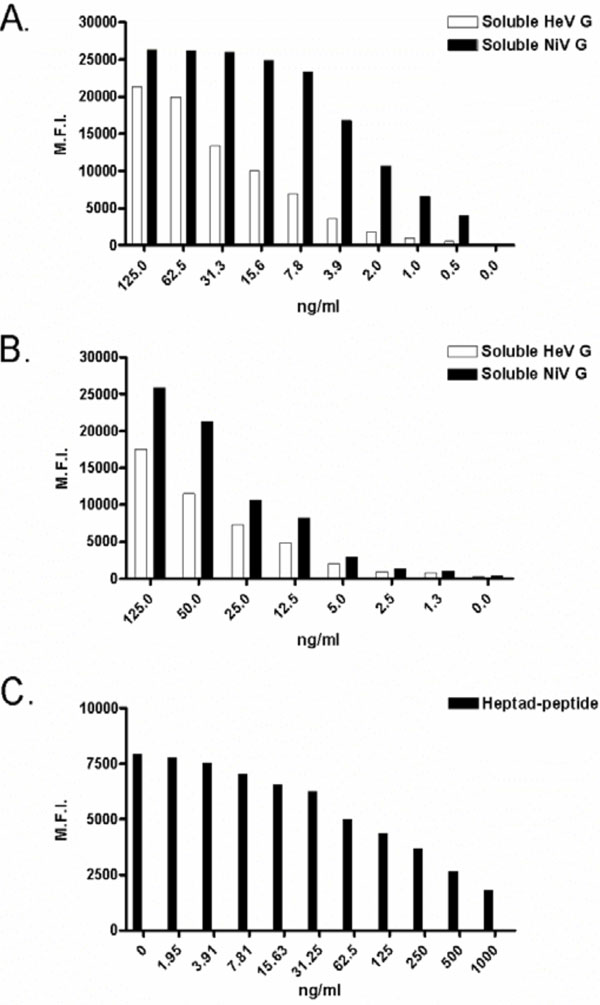
Fig. (3) Standard curves using new pharmacological assays for various post-exposure therapeutic agents. For each graph, median fluorescent intensity (M.F.I.) is shown on the Y-axis and concentration is shown on the X-axis. For panels A and B binding to soluble HeV G- and soluble NiV G-coupled microspheres are indicated by white and black bars, respectively. For panel C binding of antibody to peptide-coupled microspheres in the presence and absence of free peptide is indicated by black bars. A: Binding of recombinant human m102.4 IgG1 monoclonal antibody; B: Binding of recombinant soluble ephrin-B2 ligand; C: Competition by soluble heptad-derived peptide.