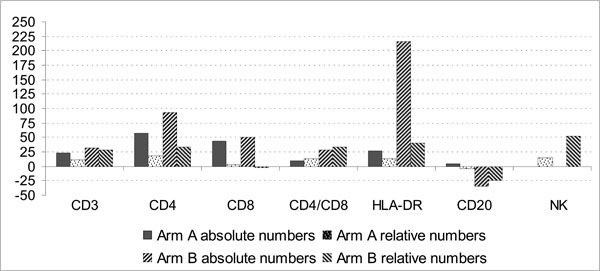
Fig. (1)
Changes in absolute and relative numbers of peripheral blood cell subpopulations at 2 months post-therapy as expressed in percentage values (Y-axis) relative to their respective baseline levels.