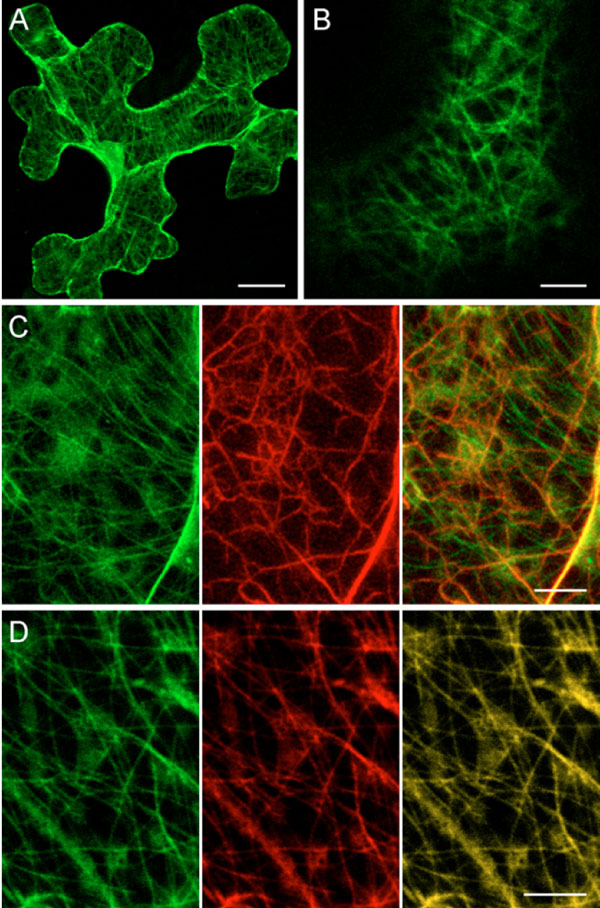
Fig. (1) Localization of PMTV TGBp1 fused to GFP in bombarded N. benthamiana epidermal cells imaged 24 hours post bombardment. A and B, localization of GFP-TGBp1. B, single optical section in the cortical region of cell expressing GFP-TGBp1. C, co-expression of GFP-TGBp1 with YFP-Tal. D, co-expression of GFP-TGBp1 with YFP-MAP4. In C and D, GFP signal is shown in the left panel, YFP signal (the middle panels) was digitally pseudocolored with red to facilitate interpretation of merged images (the right panels). The images, except B, are reconstructed by superposition of series of confocal optical sections. Scale bars: A, 20 µm; B, 5 µm; C and D, 10 µm.