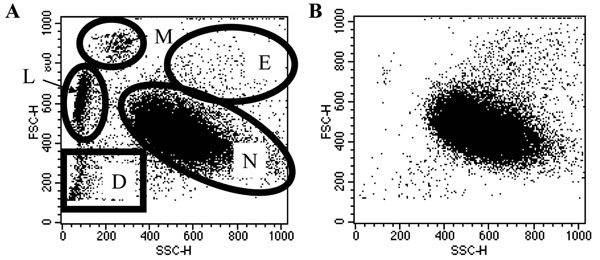
Fig. (1) Representative dot plots of plasma: Percoll (A) and ultra-purified (B) neutrophil populations. Discrete cell populations can be identified, as shown in A: M = monocytes; L = lymphocytes; N = neutrophils; E = eosinophils; D = red blood cells and any cellular debris.