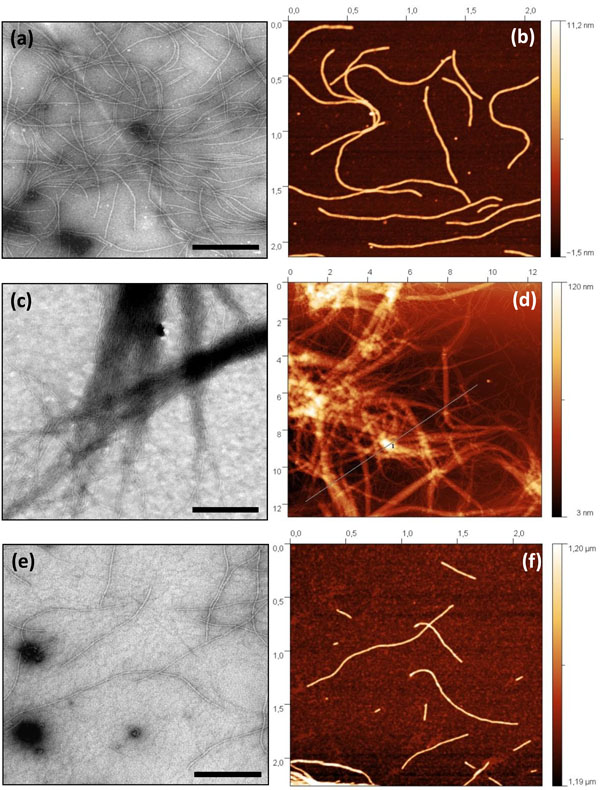
Fig. (2) TEM and AFM images of AltMV-MU virions and VLPs assembled from AltMV-MU CP at different pH-conditions: AltMV-MU
virions at pH 8.0 (a, b); AltMV-MU CP at pH 4.0 (c, d); AltMV-MU CP at pH 8.0 (e, f). TEM images - (a, c, e); AFM images - (b, d, f).
Scale bars represent 500 nm (a, c, e).