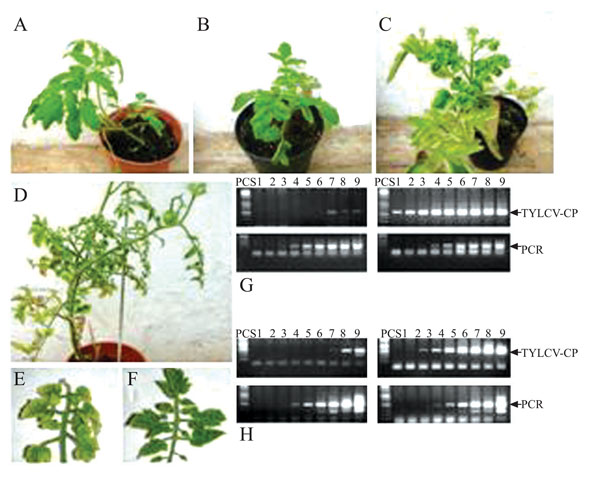
Fig. (3) Examples of TYLCV resistance/tolerance obtained by C4 silencing. Frames A, B and C exemplify the engendering of resistance/tolerance. Plants shown in frames A and B were injected with pIR-C4-RI 7 days prior to inoculation. The plant in frame C is a TYLCV-infected untreated control. Pictures were taken 30 days post-inoculation. Plant A is a one of the symptomless resistant plants, and plant B has only mild symptoms. Frames D, E, and F show an example of recovery. The plant shown in frame D was injected with IR-C4-RI 3 months after inoculation. The new growth of the heavily infected plant was symptomless; the plant overcame stunting, and produced flowers and normal-looking fruit. Frame E exhibits symptom-laden leaves of the lower part of the plant. Frame F shows recovered leaves of the upper part of the plant. Frames G and H demonstrate the reduction in virus titer in resistant and recovered plants by semi-quantitative PCR with TYLCV-CP primers. Frame G shows PCR products with DNA from Plant A (upper left panel) and plant C (upper right panel) following 18 to 34 PCR cycles (lanes 1-9). The lower panels show the results obtained with the same DNA similarly amplified with primers for the constitutive gene PDS. Frame H shows the results of semi-quantitative PCR obtained from DNA extracted from the recovered upper leaves of plant D (Upper left panel) versus that of the recovered upper leaves (upper right panel). Internal controls with the constitutive gene PDS is shown in the respective lower panels.