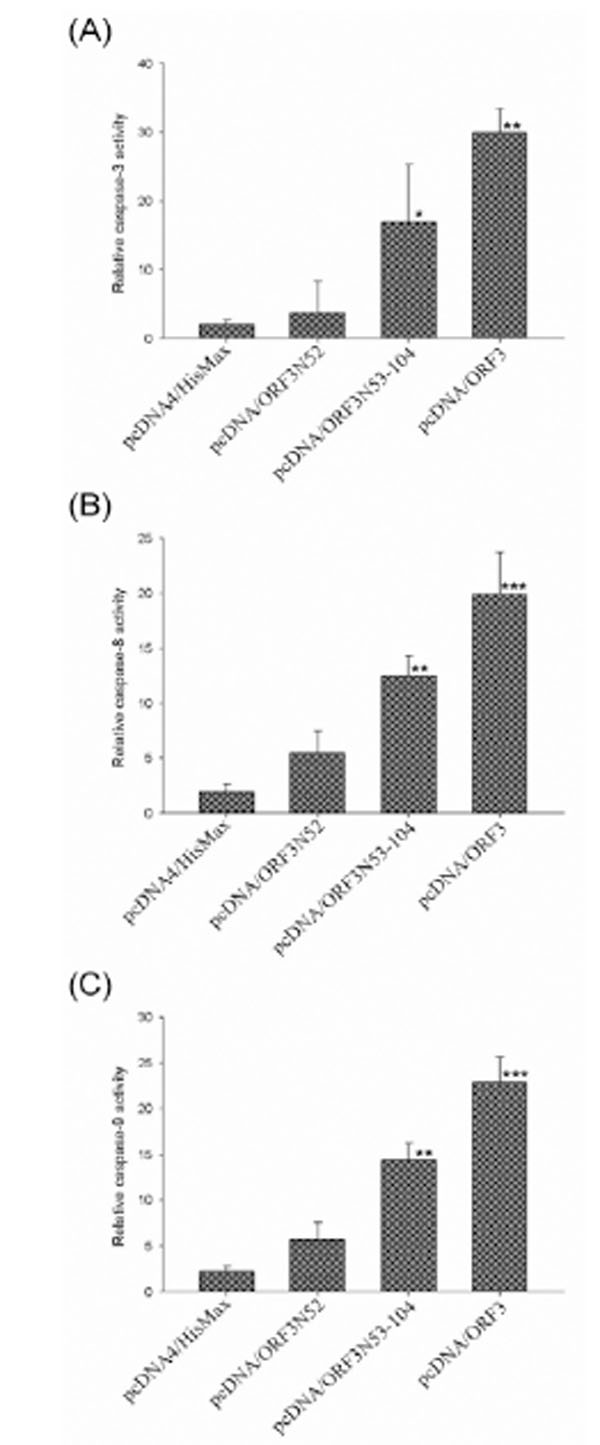
Fig. (3) Analysis of caspase activities of PBMC transfected cells at 48 h post-tranfection. The bars show the relative caspase-3 (A), -8 (B), -9 (C) activity as the ratio of absorbance at 405 nm of each plasmid-transfected cells to mock PBMC. *Significant different (p<0.05) from pcDNA4/HisMax. **p < 0.01, ***p < 0.001.

