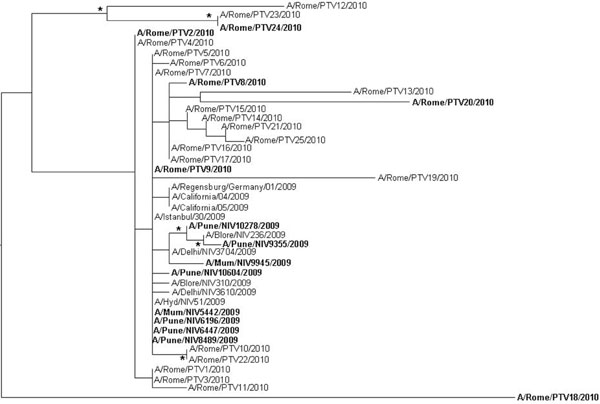
Fig. (1) Maximun likelihood phylogenetic analysis of H1N1 HA sequences. The data set included sequences isolated from patients admitted at Tor Vergata hospital. The tree was rooted by using the midpoint rooting method. Branch lengths were estimated with the best fitting nucleotide substitution model (HKY+I+G) according to a hierarchical likelihood ratio test, and were drawn to scale with the bar at the bottom indicating 0.0090 nucleotide substitutions per site. One asterisk (*) along a branch represents significant statistical support for the clade subtending that branch (p<0.001 in the zero-branch-length test and bootstrap support >75%). The strains isolated from severe cases are in bold.