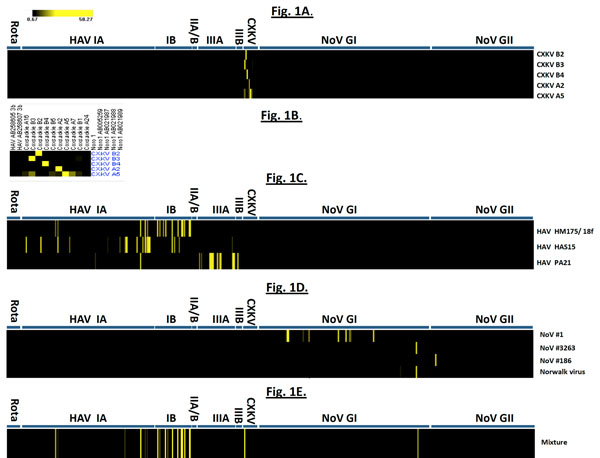
Fig. (1) (A) Hybridization results from 5 CXKV strains. The average hybridization intensity of oligoprobes from each CXKV strain was calculated and converted to a color scheme in which signal intensity over the threshold value of 3.0 was depicted as a yellow vertical strip. Black indicates signal intensity below the threshold value. (B) The expanded view of the hybridization profile. (C) Hybridization result of three HAV strains HM175/18f, HAS15, and PA21 representing subgenotype IB, IA and IIIA, respectively. (D) Hybridization result from four norovirus samples of NoV#1, #3263, #186 and Norwalk virus. (E) Simultaneous detection of multiple viruses: CXKV B3, HAV strain HM-175/18f and NoV#3263. A mixture of labeled cDNA from three unrelated viruses was co-hybridized to the microarray. Hybridization signal intensities specific to the respective virus samples are displayed in strips on the graph.