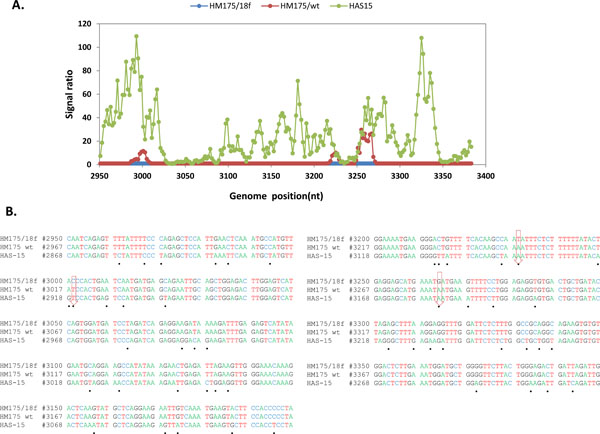
Fig. (2) Analysis of sequence variation in HAV VP1/2A region. (A) Comparative hybridization profile of HM175/wt and HAS15 in relation to HM175/18f in VP1/2A region. Microarrays were hybridized to viral RNA isolated from the reference strain HM175/18f and test strain of HM175/wt and HAS15, respectively. The hybridization signal from each oligoprobe in that region within the reference strain was divided by the respective signal in the test virus. The signal ratio obtained from reference and test strain is shown with respect to genome position of 18f. The x axis is nucleotide position numbering of 18f. The y axis is the ratio measurement obtained. Hybridization peak indicates nucleotide changes present in the test strains. (B) Sequence alignment of VP1/2A region from the three strains. Black dot shows the nucleotide changes in HAS15 compared to 18f. Down arrow indicates the nucleotide changes present in HM175/wt.