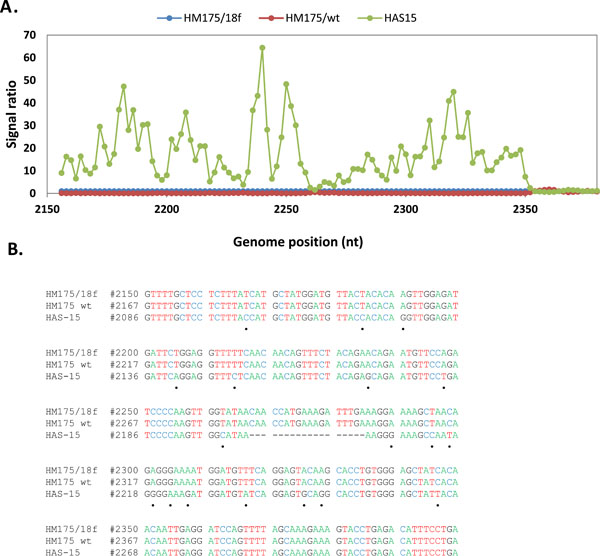
Fig. (3) Analysis of sequence variation in HAV VP3/VP1region. (A) Comparative hybridization profile of HM175/wt and HAS15 in relation to HM175/18f in VP3/VP1 region. Hybridization peak indicates nucleotide changes present in HAS15. (B) Sequence alignment of VP3/VP1 region from the three strains. Black dot indicates the nucleotide changes present in HAS15. No nucleotide changes are present in the region between HM175/wt and18f.