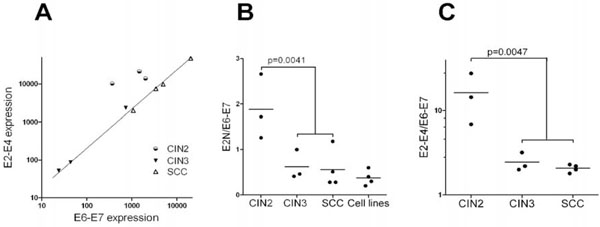
Fig. (4) Relative transcription of viral genes: A) E2 transcription (measured with the E2-E4 probe) was plotted as a function of E6-E7
transcription. Note that CIN3 and SCC samples are perfectly aligned while the three CIN2 samples are not. B) The ratio of E2 transcripts
(measured with the E2N probe) over E6-E7 transcripts was plotted for CIN2, CIN3, SCC and HPV16-associated cell lines (Caski, Caski-E2,
SiHa and IC3). C) Same as in B, except E2 transcription was measured using the E2-E4 probe. Cell lines were not included in the
comparison since no E2-E4 signal was detected for SiHa or IC3. P-value were calculated using 2-tail t-test. Data are from Table 1.