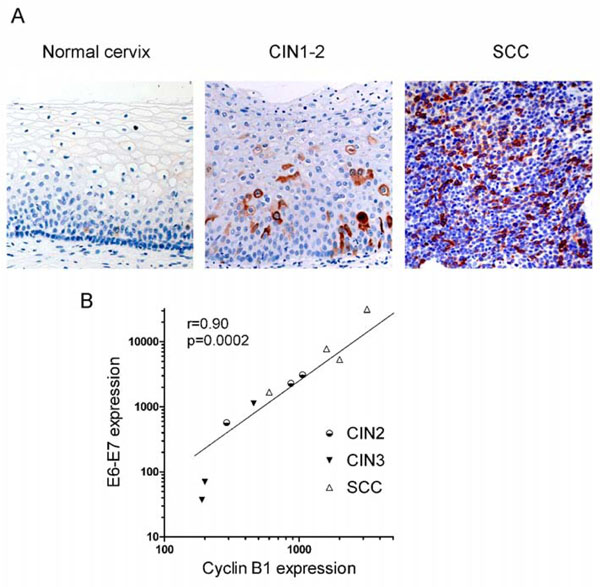
Fig. (5) Cyclin B1 expression both at protein and transcription levels increases from normal cervix to SCC. A) Cyclin B1 staining obtained
by IHC in normal cervix, CIN1-2 and SCC samples as indicated (20X). B) Correlation between E6-E7 and cyclin B1 transcription.
Correlation coefficient and p-value were computed using 1-tail Pearson correlation test. Data are from Table 1.