- Home
- About Journals
-
Information for Authors/ReviewersEditorial Policies
Publication Fee
Publication Cycle - Process Flowchart
Online Manuscript Submission and Tracking System
Publishing Ethics and Rectitude
Authorship
Author Benefits
Reviewer Guidelines
Guest Editor Guidelines
Peer Review Workflow
Quick Track Option
Copyediting Services
Bentham Open Membership
Bentham Open Advisory Board
Archiving Policies
Fabricating and Stating False Information
Post Publication Discussions and Corrections
Editorial Management
Advertise With Us
Funding Agencies
Rate List
Kudos
General FAQs
Special Fee Waivers and Discounts
- Contact
- Help
- About Us
- Search


The Open Condensed Matter Physics Journal
(Discontinued)
ISSN: 1874-1924 ― Volume 4, 2013
A Selective Review of the Simulation of the Defect Structure of Dislocation-Free Silicon Single Crystals
V.I. Talanin *, I.E. Talanin
Abstract
A brief review of the current state of theoretical description of the formation of the defect structure of dislocation-free silicon single crystals was carried out. Emphasis was placed on a new diffusion model of formation grown-in microdefects. It is shown that the diffusion model can describe the high-temperature precipitation of impurities during the cooling of the crystal after growth. Shown that the model of the dynamics of point defects can be considered as component part of the diffusion model for formation grown-in microdefects.
PACS: 61.72.Bb; 61.72.Ji; 61.72.Yx.
Article Information
Identifiers and Pagination:
Year: 2009Volume: 4
First Page: 8
Last Page: 31
Publisher Id: TOCMPJ-4-8
DOI: 10.2174/1874186X01104010008
Article History:
Received Date: 24/8/2011Revision Received Date: 27/11/2011
Acceptance Date: 29/11/2011
Electronic publication date: 9/10/2009
Collection year: 2009
open-access license: This is an open access article licensed under the terms of the Creative Commons Attribution Non-Commercial License(http://creativecommons.org/licenses/by-nc/3.0/), which permits unrestrictive use, distribution, and reproduction in any medium, provided the original work is properly cited.
* Address correspondence to this author at the Department of Programming and Information Technology, Classic Private University, Zaporozhye, Ukraine; Tel/Fax: +(38) 0612639973; E-mail: v.i.talanin@mail.ru
| Open Peer Review Details | |||
|---|---|---|---|
| Manuscript submitted on 24-8-2011 |
Original Manuscript | A Selective Review of the Simulation of the Defect Structure of Dislocation-Free Silicon Single Crystals | |
1. INTRODUCTION
A vast majority of modern microelectronic and nanoelectronic devices are built on the monocrystalline silicon substrates produced from the crystals grown by the Czochralski (CZ) process and the float-zone (FZ) process. Many of the advances in integrated-circuit (IC) manufacturing achieved in recent years would not have been possible without parallel advances in silicon-crystal quality and defect engineering. These studies are now approaching values that will allow the silicon starting material to be used in the production of critical component dimensions below 18 nm.
Silicon crystals grown by the Czochralski process and floating zone method typically contain many structural imperfections termed grown-in microdefects. Grown-in microdefects degrade the electronic properties of microdevices fabricated on silicon wafers. Optimizing the number and size of grown-in microdefects is crucial to improving processing yield of microelectronic devices. The problem of defect formation in dislocation-free silicon single crystals during their growth is a fundamental problem of physics and chemistry of silicon. This problem is key to solving other complex problems in physics, chemistry, materials science and engineering applications of silicon crystals.
At present, numerous studies of dislocation-free silicon single crystals have provided a wide variety of scientific data on the regularities of the formation and interaction of point defects and enormous practical experience has been gained in growing perfect single crystals. Such a large database on the structural properties and the influence of defects on the physico-chemical properties of silicon has not been created for other dislocation-free single crystals. At the same time, there has been no unified theoretical approach to the description of the interaction of point defects and the formation of an initial defect structure of dislocation-free silicon single crystals.
This paper reviews the major developments in understanding and quantifying the physics of the formation of grown-in microdefects. The main theoretical models of formation grown-in microdefects are analyzed. In contrast to models of the dynamics of point defects, we show that the bases of the formation of grown-in microdefects are processes of high-temperature precipitation. The new diffusion model of formation grown-in microdefects is proposed. The diffusion model allows to fully describing the process of defect formation in crystals during cooling after growth. This model is applicable for the dislocation-free silicon crystals of any diameter in the temperature range of cooling 1683...300 K.
2. CLASSIFICATION OF GROWN-IN MICRO-DEFECTS: EXPERIMENTAL RESEARCHES OF GROWN-IN MICRODEFECTS IN DISLOCATION-FREE SILICON SINGLE CRYSTALS
Two approaches to the classification of grown-in microdefects in single crystals grown by methods of floating-zone (float zone silicon, FZ-Si) and Czochralski (Czochralski silicon, CZ-Si) are there. The first approach is based on the results of experimental studies using selective etching patterns of distribution of grown-in microdefects in the planes (111) and (112), depending on the crystal growth rate. According to these studies was developed of experimental classification of grown-in microdefects. Experimental classification of grown-in microdefects is based on the use of methods of selective etching, X-ray topography and transmission electron microscopy. It was developed in the works [1-6]. A.J.R. de Kock entered into circulation the name of A-microdefects and B-microdefects [1, 2], whereas Е.G. Sheihet entered into circulation the name C-microdefects, D-microdefects and (I+V)-microdefects [4-6]. These research allowed to establish the physical nature of A-microdefects, B-microdefects, C-microdefects, D-microdefects and (I+V)-microdefects. The classification was developed taking into account the thermal conditions of growth and sign of deformation of the crystal lattice, caused by the defect (which is defined by us as the physical nature of the defect). Experimental results indicated the identity of the processes of defect formation in crystals of FZ-Si and CZ-Si [7]. This means that the classifications of grown-in microdefects in both types of crystals should also be identical [7].
The second approach to the classification of grown-in microdefects in dislocation-free silicon single crystals should be considered as a technological. The larger the diameter of the growing crystal, the lower growth rate, at which the same type of grown-in microdefects is formed. This occurs by reducing the axial temperature gradient in the crystal [8]. This leads to the appearance of a new type of grown-in microdefects (microvoids) and dislocation-free crystal growth in a narrow range of growth rates [9]. In large crystals of interstitial dislocation loops and microvoids are considered as major grown-in microdefects in dislocation-free silicon crystals [8-10].
Let us briefly consider the types grown-in microdefects, which are included in experimental and technological classifications.
(I+V)-microdefects. They are represents a simultaneously coexisting in the same regions of the crystal grown-in microdefects of interstitial (Interstitial, I) and vacancy (Vacancy, V) types. The concentrations grown-in microdefects of the interstitial and vacancy types have comparable values. Were first discovered in the course of experiments using selective etching and X-ray topography in combination with the subsequent decoration with copper [4, 11]. The authors of [11] made an erroneous assumption of about only the vacancy nature of these defects. In [12, 13] it has been suggested that under certain temperature conditions possibly simultaneous coexistence of vacancy and interstitial defects. In [6] using transmission electron microscopy was investigated in detail the physical nature of the defects that were discovered in [4, 11]. It was shown that they really are (I+V)-microdefects.
It was found that (I+V)-microdefects begin to form in the FZ-Si with a diameter of 30 mm at rates growth between 6.0 ... 6.5 mm/min, while in CZ-Si with a diameter of 50 mm at rates growth between 1.5...1.8 mm/min [7]. It was found that in crystals of FZ-Si with a diameter of 30 mm at rate growth 6.0 mm / min the concentration of microdefects of interstitial and vacancy types are in the relation 4:1 [6]. With increasing of growth rate fraction of vacancy type of defects increases in (I+V)-microdefects [14]. The concentration of defects is ~ 1013 ... 1014 cm-3, their size is 3 ... 12 nm [6, 15]. It was found that in crystals quenched during the growth of the microdefects of interstitial and vacancy types have approximately the equal concentrations [14]. It is established that (I+V)-microdefects are the primary oxygen-vacancy and carbon-interstitial agglomerates [15, 16]. They are formed on the impurity centers and represent the primary element the subsequent transformation of the defect structure of crystal FZ-Si and CZ-Si [14].
D(C)-microdefects. D(C)-microdefects were first detected in FZ-Si after selective etching in a uniform distribution [4]. The crystal growth rate was more than 4.5 mm/min, diameter crystal was 30 mm. In CZ-Si these defects were first observed in [17]. With the help of electron microscopy research were identified defect sizes (~ 3 ... 10 nm) and their concentrations (~ 1013 ... 1014 cm-3) [18].
We note that in paper [11], not only (I+V)-microdefects were erroneously identified as vacancy defects, but also erroneously these defects have been named D-microdefects. The results of paper [11] have generated debate about the nature of D-microdefects. For example, it was assumed that D-microdefects are divided into subclasses and have of interstitial and vacancy nature [19]. However, most researchers on the basis of papers [11, 20] done an assumption about the vacancy nature of D-microdefects.
Detailed electron microscopic studies showed that D-and C-microdefects in FZ-Si and CZ-Si are completely identical of electron microscopic images and the sign of the deformation of the crystal lattice. They are the interstitial and vacancy defects [21]. In contrast to (I+V)-microdefects the concentration of vacancy D(C)-microdefects two orders of magnitude lower than the concentration of interstitial D(C)-microdefects [21]. With decreasing crystal growth rate of the defect sizes are increases [14]. It is shown that D (C)-microdefects are uniformly distributed in macrovolume of small B-microdefects [14].
B-microdefects. B-microdefects are the next stage of development of D(C)-microdefects. It should say that D(C)-microdefects are uniformly distributed small B-microdefects, or that B-microdefects are big D(C)-microdefects in the banded distribution [14].
B-microdefects were first observed simultaneously with the A-microdefects in FZ-Si as the pits with a flat bottom in the form of equilateral triangles with sides along to directions the [110] on the plane (111) [1, 22]. The distribution of etch pits in the cross section of the single crystal was in the form of turbulences. Therefore A-microdefects and B-microdefects were identified as swirl-defects (swirl defects) [23, 24]. In CZ-Si, these defects were first observed in [17].
B-microdefects are interstitial and vacancy nature [21, 25, 26]. Dimensions of interstitial defects are within 15 ... 50 nm, their concentration is ~ 1010 cm-3 [14]. Concentration of vacancy B-microdefects two orders of magnitude lower than the concentration of interstitial B-microdefects [21, 25, 26]. Part B-microdefects, which has of square and rhombic shapes in projection on the planes {111} represents oxygen precipitates [14]. Another of their part is a carbon precipitates [14].
A-microdefects. A-microdefects are separate dislocation loops with sizes within 1 ... 5 µm or cluster of such loops of interstitial type [2, 3]. The size of interstitial dislocation loops is inversely proportional to the crystal growth rate. In some cases, the dislocation line loops decorated of background impurities of carbon and oxygen. A-microdefects are interstitial type dislocation loops with Burgers vector
With increasing the size of A-microdefects to some value in single crystals arise of dislocations [27, 28]. On the occurrence of dislocations affect the sizes and relative position of microdefects and the distance between them [29].
Transformation of the initial defect structure during the growth of dislocation-free single crystals occurs to the scheme: (I+V)-microdefects → D(C)-microdefects → B-microdefects → A-microdefects [14]. (I+V)-microdefects, D(C)-microdefects and B-microdefects are precipitates of background impurities of carbon and oxygen. Sizes and shape of the precipitates are defined the temperature conditions of crystal growth.
OSF-ring. In large crystals CZ-Si (diameter ≥ 100 mm) after thermal oxidation in the plane (111) is formed ring distribution of oxidation stacking faults (OSF-ring) [30]. Stacking faults are formed around the plate of oxygen precipitates [31]. Volume density of precipitates does not change with increasing oxidation time. This means that the formation of precipitates takes place during crystal growth. OSF-ring is observed in crystals (diameter 150 mm) grown at 0.7 ... 0.8 mm/min and is absent in crystals grown at 0.4 mm/min and at 1.1 mm/min [31].
OSF-ring nucleates at the precipitates of distribution ring D-microdefects in the plane (111) [14]. Established that ring D-microdefects in the plane (111) is composed of precipitates of oxygen and carbon [14]. In the plane (112) OSF-ring corresponds to V-shaped or W-shaped distribution of D-microdefects.
Vacancy microvoids. Currently the vacancy microvoids (or microvoids) are defined as defects inside the OSF-ring in the large crystals of CZ-Si. In papers [32, 33] were first carried out electron microscopic study of crystals with microvoids. Octahedral shape of these defects was determined. The sizes of microvoids are within 100 ... 500 nm [32, 34]. Found that the concentration of microvoids is within 104...105 cm-3 [34].
Established that the microvoids are formed in the temperature range 1403...1343 K [34]. Formation of the microvoids is occurs in two stages [35]. In the first stage in the temperature range 1403...1343 K occurs rapidly growth of sizes. In the second stage in the temperature range 1323…1173 K occurs precipitation of oxygen and carbon atoms on the inner side of the vacancy complex. These results were confirmed by subsequent researches [34, 36].
Analysis of the experimental results of investigations of grown-in microdefects indicates that there are only three types of grown-in microdefects: precipitates of impurities ((I+V)-microdefects, D(C)-microdefects, B-microdefects), interstitial dislocation loops (A-microdefects) and microvoids. The modern classification of grown-in microdefects should take into account this fact. Therefore it must be built on a different basis.
3. THE MODELING FORMATION OF THE GROWN-IN MICRODEFECTS
For research formation of grown-in microdefects must know the physical phenomena occurring during growth in dislocation-free silicon single crystals. In turn, the mathematical model should describe the full range of physical phenomena.
Modern computational methods and modern computers allow you to perform detailed parametric investigations of mathematical processes is very complex physical processes. Such investigations are called of the computational experiment. Computational experiment in the most general form consists of the following stages: (i) determination (or choice) the physical model of the system; (ii) choice of mathematical model, which is an adequate physical model; (iii) choice or development of a method of calculation in accordance with the mathematical model; (iv) the creation of the program for calculating with the help of the computer; (v) conducting multivariate calculations and processing of their results; (vi) calculation results are compared with experimental data or other theoretical researches. Then are held refinement the mathematical and physical models of the system. The general concept of computational experiment allows us to supplement experimental research results.
3.1. Physical Modeling
During the years 1975-1982 were proposed several physical models of formation of grown-in microdefects: (i) equilibrium interstitial-type model [24]; (ii) non-equilibrium interstitial-type model [2]; local melting model (drop model) [37]; vacancy-type model [38]; vacancy-interstitial type model [23, 39]. In article [40] was carried out a critical review these of the physical models. The analysis showed that none of the models does not explain the experimental data on the research of grown-in microdefects. In 1982 he was proposed the recombination-diffusion model [20]. This model can be considered as a symbiosis of all pre-existing models.
Recombination-diffusion model assumes fast recombination of intrinsic point defects at the initial moment of cooling the grown crystal [20]. Fast recombination determines the type of dominant intrinsic point defects in the crystal. The result of the recombination selection depends on the ratio transport flows of intrinsic point defects in the growing crystal (determined the rate of crystal growth, Vg) and diffusion of intrinsic point defects near the crystallization front (determined by an axial temperature gradient, G). For large values of the ratio Vg/G the contribution of diffusion is assumed small. In this case will be dominated defects with higher initial concentration. For small values of Vg/G basic is expected contribution of diffusion. In this case will be dominated defects with higher diffusion coefficient.
In this model was first used mathematical tool which allows you to associate the defect structure of crystal with distribution in the crystal thermal fields during the growth. This was achieved by introducing into consideration the of the growth parameter Vg/G. It is assumed that in the case Vg/G < ξcrit formed only interstitial A-microdefects as a result of aggregation of intrinsic interstitial silicon atoms. It is assumed that in the case Vg/G > ξcrit formed only microvoids as a result of aggregation of vacancies. OSF-ring in this model represents a region where are of the small oxygen precipitates of vacancy type [9, 41].
In this physical model, the interaction between the impurities and intrinsic point defects is not considered [10]. It is assumed that at cooling of the crystals in the temperature range 1683...1423 K, depending on the thermal conditions of growth formed tiny (invisible) clusters of vacancies (D-microdefects) or intrinsic interstitial silicon atoms (B-microdefects). It is assumed that these clusters at 1223 K< T ≤ 1423 K transformed into a microvoids or interstitial dislocation loops (A-microdefects) accordingly [10]. This process of transformation leads to a sharp reduction in the concentrations of intrinsic point defects in the relevant parts of the crystal. With further cooling of the crystal residual intrinsic point defects are involved in the formation in these areas of oxygen clusters [9].
Recently within this model are made attempts to explain the effect of impurities on the formation of grown-in microdefects. In article [42] suggested that during the cooling of the crystal in the temperature range 1683...1423 K occurs the formation of complexes VO and VO2 (where V is the vacancy, O is the oxygen). However, these complexes do not lead to the formation of precipitates in this temperature range. Free and bound (VO and VO2) vacancies are expended initially on the formation of microvoids (1223 K< T ≤ 1423 K) and then are expended on the formation of O-clusters (precipitates of oxygen) at T < 1223 K [42]. Exactly the same approach applies to nitrogen impurity with similar results of calculations [43]. In the articles [42, 43] ignored the effect of impurities on the formation of interstitial grown-in microdefects. Also in these papers ignored the participation of intrinsic interstitial silicon atoms during the formation of vacancy microdefects.
In the general case recombination-diffusion model assumes that the process of defect formation in dislocation-free silicon single crystals occurs in four stages: (i) fast recombination of intrinsic point defects near the crystallization front; (ii) the formation in the narrow temperature range 1423...1223 K depending on the value of Vg/G microvoids or interstitial dislocation loops; (iii) the formation of oxygen clusters in the temperature range 1223...1023 K; (iv) growth of precipitates as a result of subsequent heat treatments.
Based on the synthesis of numerous experimental and theoretical research as the physical model we have developed the two-stage mechanism for the formation and transformation of grown-in microdefects ( or heterogeneous mechanism) [7, 14]. This physical model on the experimentally and theoretically established fact the absence of recombination of intrinsic point defects near the crystallization front of the crystal is based [44]. It is assumed that due to of the elastic interaction between the intrinsic point defects and the residual impurities the vacancies and intrinsic interstitial silicon atoms are drains on impurities of oxygen and carbon accordingly [14]. More details two-stage mechanism for the formation and transformation of grown-in microdefects will be discussed in paragraph 3.
3.2. Mathematical Modeling
At present, the defect formation processes in a semiconductor crystal, in general, and in silicon, in particular, have been described using the model of point defect dynamics; in this case, the crystal has been considered a dynamic system and real boundary conditions have been specified [10, 41-43, 45]. The mathematical model of point defect dynamics in silicon quantitatively explains the homogeneous mechanism of formation of microvoids and interstitial dislocation loops and provides the basis for the understanding of the relation between the defect crystal structure and the processes occurring in the melt [10]. The concentrations of defects have been calculated under the assumption of a rapid recombination of vacancies and intrinsic interstitial silicon atoms in a relatively narrow region in the vicinity of the crystallization front. This circumstance leads to the fact that primary defects (vacancies and intrinsic interstitial silicon atoms) are characterized by equilibrium concentrations [20]. The concentration of remaining primary defects after the passage of the narrow recombination region can be determined reasoning from the flux of defects deep into the crystal. Further cooling and pulling of the crystal are accompanied by the formation of aggregates of primary defects: microvoids in the region of dominance of vacancies and interstitial dislocation loops in the region of dominance of intrinsic interstitial silicon atoms.
In the general case, the model describing the defect dynamics in a crystal involves the kinetics of Frenkel reactions, nucleation of point defects, growth of clusters, and point defect balance [10]. The mutual annihilation and the formation of pairs of point defects over the entire volume of the crystal are considered in the kinetics of Frenkel reactions. A series of bimolecular reactions is considered in the section of nucleation of point defects. The motion of complexes of point defects in the direction from the melt-crystal interface is considered in the section of cluster growth. The balance of point defects includes their diffusion and convection, Frenkel reactions, and their consumption for the formation of clusters. The basic equations for the point defect balance are written in the following form:
Here,
In the simulation of the formation of interstitial dislocation loops and microvoids, the authors of the model of point defect dynamics consider their nucleation and formation in a narrow temperature range
In Eqs. (1) and (2), the variations in the point defect concentrations are due to their diffusion (first term), convection (second term), Frenkel reactions (third term), their consumption for the existing clusters (fourth term), and the formation of new clusters (fifth term). The rate of consumption of point defects for the formation of new clusters is negligible and, subsequently, can be ignored [10].
The diffusion-limited growth rates of clusters (for any z and t) formed at the corresponding quantities ξ and τ are described by the equations
where ψ is the density of monomers in the cluster.The equations for the nucleation rates are represented in the form
where F* is the maximum change in the free energy and ρsite is the concentration of nucleation sites (in formula (5)).
The initial length or height of the crystal is taken to be 0. For the crystal with a finite length h, the equilibrium conditions are assumed to be dominant over the entire surface, including the crystal-melt interface:
The initial size of the steady-state critical cluster is negligible as compared to the microdefect size. Consequently, the initial size of the stable cluster insignificantly affects its final size. The initial size of the stable cluster (nucleus) is calculated from the number of monomers in the critical cluster:
Equations (1)-(13) together with the energy balance of the hot zone control and determine the quantitative dynamics of point defects. In semiconductor industry, the crystal quality has been frequently determined from the total concentration or total density and represented by the average size of existing clusters [10]. The total density of clusters is calculated by summation of clusters of different sizes in the current state:
The average cluster radius is defined as
where avg stands for the average volume.
The model of point defect dynamics under consideration is one-dimensional in nature, and, hence, the influence of the radial diffusion that is dominant in the vicinity of the surface of the crystal is disregarded. Therefore, the model can be applied to an axial distribution of defects in the crystal for fixed radial positions far from the surface. The energy balance can be calculated using the quasi-steady-state approximation [10].
It should be noted that, in the general case, the model of point defect dynamics includes three approximations: rigorous, simplified, and discrete-continuum approaches. The rigorous model requires the solution to integro-differential equations for point defect concentration fields, and the distribution of grown-in microdefects in this model is a function of the coordinates, the time, and the time of evolution of the size distribution of microdefects [41, 46]. A high consumption of time and cost for the performance of calculations required the development of a simplified model in which the average defect radius is approximated by the square root of the average defect area. This approximation is taken into account in the additional variable, which is proportional to the total area of the defect surface. The simplified model is effective for calculating the two-dimensional distribution of grown-in microdefects [42]. Both models use the classical nucleation theory and suggest the calculation of the formation of stable nuclei and the kinetics of diffusion-limited growth of defects. The discrete-continuum approximation suggests a complex approach: the solution to discrete equations for the smallest defects and the solution to the Fokker-Planck equation for large-sized defects [47].
4. THE TWO-STAGE MECHANISM FOR THE FORMATION AND TRANSFORMATION OF GROWN-IN MICRODEFECTS (HETEROGENEOUS MECHANISM)
As mentioned above, a two-step mechanism of formation of grown-in microdefects in contrast to the recombination-diffusion model based on the assumption about the absence of recombination intrinsic point defects at high temperatures. This assumption was confirmed in several experimental works [7, 15]. In paper [44] we first theoretically proved the absence of recombination of intrinsic point defects at high temperatures and fast recombination at low temperatures.
4.1. Determination of Recombination Parameters of Point Defects
The inclusion of the entropy barrier and the coefficient of joint self-diffusion of vacancies and interstitial silicon atoms in thermodynamic calculations leads us to the conclusion that there exists a recombination barrier [7]. However, this conclusion is inconsistent with the Voronkov theory. It should be noted that the experimental results obtained from transmission electron microscopy and the heterogeneous mechanism of formation of grown-in microdefects confirm the theoretical assumptions made earlier by Hu [23] and Sirtl [39].
The microscopic model of a recombination barrier was thoroughly developed by Gösele et al., [48]. In essence, this model is as follows: the dependence of the barrier height on the temperature is determined by the configuration of intrinsic point defects at high temperatures. In the framework of the model under consideration, it is assumed that, at high temperatures, intrinsic interstitial silicon atoms and vacancies are extended over several atomic volumes (eleven atoms occupy ten unit cells). This means that, around a point defect, there is a disordered isotropic region extending up to the atoms involved in the second coordination sphere. According to the results reported in the aforementioned papers, recombination can occur only when defects of two types are simultaneously contracted in the vicinity of one atomic volume. Since the extended defect configurations are characterized by a larger number of microstates as compared to those of a point defect, this contraction leads to a decrease in the entropy and, consequently, an entropy barrier ∆S < 0 exists. As the temperature decreases, the entropy barrier is considerably reduced and disappears completely at low temperatures and defects readily recombine. This process is associated with the variations observed in the configurations of intrinsic point defects, which are extended at high temperatures and have a point dumbbell-like configuration at low temperatures, as was shown in [48]. It should be emphasized that the theory of extended defect configurations, as well as of a recombination barrier, was confirmed in a number of recent studies [49, 50].
At high temperatures the temperature dependence of the configurational entropy for the aforementioned model of a defect can be described by the relationship [51]:
where S∞is the limiting value of the configurational entropy
According to the model proposed in [48], the free energy of the recombination barrier can be represented by the formula
Approximate estimation at a temperature T=Tm leads to the free energy of the recombination barrier
The recombination time τ1at high temperatures can be evaluated from the expression
where Ωis the volume of the crystal lattice in the model proposed by Gösele et al. [48] andr0=3.10-8 cm is the recombination radius. Approximate estimation at a temperature leads to the recombination time τ0= 316 s. It should be noted that, according to the estimates made with the use of the recent data reported by Tang et al., [52] and Bracht et al., [53], we obtain τ0= 110 and 132 s, respectively.
The recombination factor k1v(T) is described by the theory of diffusion-limited reactions together with the kinetic activation barrier [41]. At high temperatures, the recombination factor can be written in the following form:
where cs = 5·1022 cm-3 is the atomic density. The estimation at a temperature T=Tm leads to the recombination factor k IV (1683 K) = 6.3·10-26 cm3/s. Lemke and Sudkamp [54] introduced the following criterion for “rapid recombination”: k IV (1683 K)CVm≥ 20 s-1, where CVm= 11.7·1014 cm-3 is the vacancy concentration at . For our model of point defect dynamics, the criterion for rapid recombination does not hold.
Thus, we theoretically demonstrated that the process of recombination of intrinsic point defects in Fz-Si and Cz-Si single crystals in the vicinity of the crystallization front is hindered by the recombination barrier. Consequently, we can make the inference that vacancies and intrinsic interstitial silicon atoms find their sinks in the form of oxygen and carbon background impurities, respectively.
The recombination time τ2 at low temperatures can be estimated from the relationship [55]
Under these conditions, Antoniadis and Moskowitz [56] evaluated the energy barrier at the temperature T = 1373 K (ΔG = ΔH = 1.4 eV) by means of comparing the experimentally measured lifetime of vacancies and the growth rate for a diffusion-limited reaction. The limiting value of the recombination time τ∞= 634.13 s can be determined from relationship (23) at a temperature T=Tm. As a result, we obtain
Approximate estimation leads to τ2 = 316.4 s at and τ2 → 0 at T = 723 K (estimates without regard for the vibrational entropy). At low temperatures, the recombination factor k IV ( T ) can be determined from the expression
where
Consequently, the processes of recombination of intrinsic point defects at low temperatures (for example, under conditions of ion implantation) proceed at a rather high rate. Our theoretical calculations confirm the validity of the entropy barrier model, according to which the decrease in the barrier height is caused by the decrease in the configurational entropy with decreasing temperature.
The experimental data and the results obtained from thermodynamic calculations have demonstrated that the process of aggregation of point defects dominates over the process of recombination of intrinsic point defects. At high temperatures, the process of recombination makes an insignificant contribution to the process of aggregation. Consequently, vacancies and intrinsic interstitial atoms coexist in thermal equilibrium. As a result, intrinsic point defects of both types are simultaneously involved in the process of aggregation. The decomposition of a supersaturated solid solution of point defects occurs upon cooling through two mechanisms, namely, the vacancy and interstitial mechanisms, with the formation of oxygen-vacancy and carbon- interstitial agglomerates [14].
4.2. The Physical Classification and Physical Model of Formation and Transformation of Grown-in Microdefects
Absence of recombination intrinsic point defects at high temperatures allows us to propose a new physical model of the formation grown-in microdefects. We define it as a two-stage mechanism (or heterogeneous mechanism) of formation of grown-in microdefects. Both names of the physical model of formation of grown-in microdefects are equal. The first name describes the decomposition of the supersaturated solid solution of point defects during cooling through the vacancy and interstitial mechanisms. The second name describes the role of oxygen and carbon impurities in the formation of grown-in microdefects.
The basic concepts of the heterogeneous mechanism for the formation and transformation of grown-in microdefects imply the following [14]: (i) the recombination of intrinsic point defects at high temperatures can be neglected; (ii) background carbon and oxygen impurities are involved in the defect formation as nucleation centers; (iii) the decay of the supersaturated solid solution of point defects when the crystal is cooled from the crystallization temperature occurs in two independent ways (branches): vacancy and interstitial; (iv) the defect formation is based on primary agglomerates formed as the crystal is cooled from the crystallization temperature due to the interaction between the impurities and intrinsic point defects; (v) when the crystal is cooled at temperatures below 1423 K, depending on the thermal growth conditions, secondary grown-in microdefects are formed due to the interaction between intrinsic point defects; (vi) the secondary grown-in microdefects are formed due to the coagulation (microvoids and A-microdefects) and deformation (A-microdefects) effects; (vii) the vacancy and interstitial branches of the heterogeneous mechanism have a symmetry, which implies simultaneous processes of defect formation during the decay of supersaturated solid solution of point defects; and (viii) the consequence of this symmetry is the formation of vacancy and interstitial grown-in microdefects of the same type and, correspondingly, the growth of dislocation-free Si single crystals in the same vacancy-interstitial mode (Fig. 1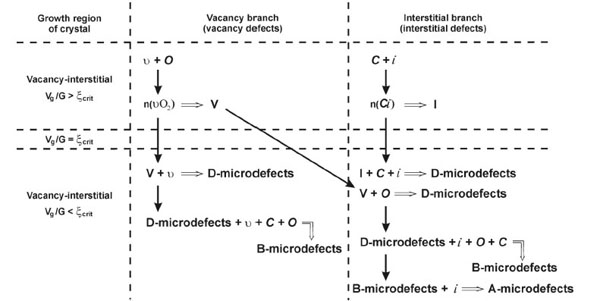 ). It was revealed that the growth parameter Vg/ G = ξcrit describes the conditions under which the (111) face appears on the crystallization front [14].

The heterogeneous mechanism of the formation of grown-in microdefects assumes that the defect formation in dislocation-free Si single crystals upon cooling occurs in three stages: (i) the formation of impurity aggregates - primary grown-in microdefects near the crystallization front, (ii) the formation and growth of impurity precipitates upon cooling from the crystallization temperature, and (iii) the formation of microvoids or interstitial dislocation loops - secondary grown-in microdefects (depending on the growth parameter Vg/ G - in a narrow temperature range of 1423…1223 K [14].
The basic elements of defect formation are primary oxygen-vacancy and carbon-interstitial agglomerates, which are formed at impurity centers near the crystallization front. An excess concentration of intrinsic point defects (vacancies or silicon self-interstitials) arises when the crystal is cooled under certain thermal conditions. This process leads to the formation of secondary grown-in microdefects (А-microdefects or microvoids) (Fig. 2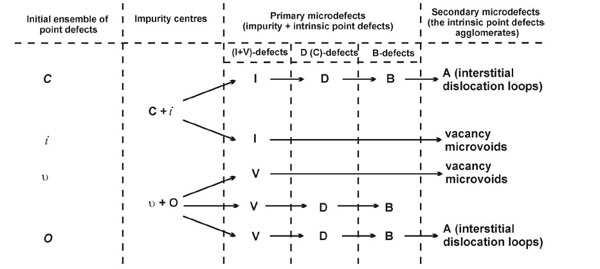 ).
).

The differences in the physical nature of the formation of primary and secondary grown-in microdefects allow one to consider the defect structure to be composed of two subsystems: primary and secondary grown-in microdefects (formed due to the impurity-intrinsic point-defect elastic interaction and the interaction between intrinsic point defects, respectively) [7, 14].
A detailed description of the heterogeneous mechanism formation of grown-in microdefects and its correspondence to the results of experimental researches are presented in the articles [7, 14].
4.3. The Diffusion Model for Formation of Grown-in Microdefects in Dislocation-Free Silicon Single Crystals
We propose a new diffusion model of the formation and transformation of grown-in microdefects. It is based on the experimental studies of undoped dislocation-free Si single crystals grown by the floating zone and Czochralski methods. The entire nomenclature of grown-in microdefects was investigated by transmission electron microscopy (TEM), standard patterns of grown-in microdefect macrodistribution depending on the thermal growth conditions were revealed, the transformation of grown-in microdefects during various technological treatments was analyzed, and the physical nature (sign of lattice strain) of all types of grown-in microdefects was determined [7, 14].
The diffusion model combines the physical model (the heterogeneous mechanism for the formation and transformation of grown-in microdefects), the physical classification of grown-in microdefects, and mathematical models of the formation of primary and secondary grown-in microdefects (Fig. 3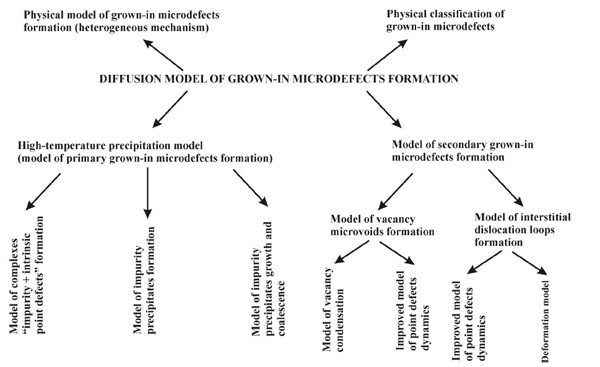 ). In paragraphs 4 and 5 we consider mathematical models for the diffusion model of the formation of grown-in microdefects.
 |
Fig. (3) Diffusion model of grown-in microdefects formation. |
5. DIFFUSION KINETIC OF HIGH-TEMPERATURE PRECIPITATION
The calculation of the precipitation is carried out within the framework of the classical theory of nucleation, growth and coalescence of precipitates. For the calculation of formation and growth of precipitates are used analytic and approximate calculations. In the case of analytical calculations applied solution of differential equations of the dissociative diffusion [57, 58]. In the case of approximate calculations, the solution is sought in the form of systems of interconnected discrete differential equations of quasi-chemical reactions to describe the initial stages of nucleation of new phases and a similar system of continuous differential equations of the Fokker-Planck [59].
5.1. Mathematical Model of Formation Complex “Impurity-Intrinsic Point Defect”
The solution is sought within the model of dissociative diffusion-migration of impurities [60]. In this case, the difference from the decomposition phenomenon is that during diffusion (as a technological process), a diffusant is supplied to the sample from an external source, whereas in the case of decomposition it is produced by an internal source (lattice sites). The theoretical analysis in the same; however, in deformation of dissociative diffusion, one has to take into account the surface concentration, which decreases in the sample volume with time and along the coordinate. The time constant is determined by the migration mechanism in the sample volume, while the coordinate dependence is determined by the sample shape and the boundary conditions of the diffusion problem.
It is difficult to interpret diffusion in multicomponent systems because it is necessary to take into account the interaction of impurity atoms. Generally, one has to use numerical methods to solve the equations; simple analytical expressions, convenient for comparison with the experimental data, can be obtained only in certain approximations. The mechanism of complex formation can be different; however, independent of the nature of the forces leading to the formation of complexes, any model assumes the action radius of these forces to be small. In this case, in analysis of the migration of point defects, a complex can be considered as a point defect.
Let us write the formation of complexes as a quasi-chemical reaction
Then, the thermodynamic equilibrium condition between the free impurities A and B and the impurity bound into AB complexes can be written in the form
where µA and µB are the chemical potentials of free impurities and µAB is the chemical potential of complexes.
If the total concentration of A and B impurities ( NA,NB) is low in comparison with the concentration of the main material,
One should take into account that, in the diffusion equations written with allowance for the complex formation, the total impurity flux is the sum of the free impurity flux and the flux of the impurity bound into complexes [61]:
where , DA,DB andDQ are the diffusion coefficients of the free components A and B and complexes, respectively; x is the coordinate (crystal length); and t is time.
The diffusion coefficient of complexes depends on the mechanism of complex formation and the type of their components. In particular, if a complex consists of two interacting atoms, the diffusion coefficient DQis much smaller than the corresponding diffusion coefficients of these atoms, DAand DB . Therefore, assuming the complexes to be low-mobile, one can neglect the last terms in Eqs. (29) and (30):
Complexes are immobile; hence, the boundary conditions are written for the free impurity. Since the equilibrium settling time for the complexes and free impurity is much shorter than the characteristic diffusion time, the total impurity concentration can be set as the initial condition.
Vas’kin and Uskov [61] considered the problem of successive diffusion of a component A into a sample singly doped with a component B , taking into account the complex formation at the initial and boundary conditions:
In this case, the diffusion equation has the form
where
The solution to the system of equations (34) with the corresponding boundary conditions (diffusion of the impurity A from a constant source into a semiconductor that is homogeneously doped with the impurity B ; the impurity B does not evaporate) in the case of strong complex formation (k = 0) is [61]:
where
λ 0is derived from the equation
Let us rewrite the system of equations (28)-(30) for the diffusion impurity kinetics of mobile complexes in terms of total components,NA=HA+Q and NB=HB+Q :
In Eqs. (35)-(41) and below,
Note that the solution to the system of equations is considered for the three cases that are most often met in practice: successive distribution, simultaneous diffusion, and interdiffusion. Under the conditions of our physical model, we can speak about successive diffusion, at which the condition of zero flux of one of the components (located at the initial instant in the sample bulk) is set at the interface. In this case, the boundary conditions have the form
Generally, the system of equations (39)-(41) with the boundary conditions (42) does not have an analytical solution; therefore, to analyze the shape of the impurity profiles, one has to analyze the limiting cases. Let us consider the approximation of strong complex formation (k = 0), which physically means that the
The solution to the problem of diffusion of a component A in a semi-infinite sample homogeneously doped with a component B , with the absence of evaporation of the component B from the sample and the presence of the free component A at the sample boundary, has the form [60]:
whereUnder physical-model conditions (heterogeneous mechanism of grown-in microdefect formation), we assume that the component A is the background impurity (oxygen O or carbon C ) and the component B is intrinsic point defects (vacancies V or interstitials I ). For the vacancy and interstitial mechanisms, we consider, respectively, the oxygen+vacancy ( O + V ) and carbon+interstitial ( C + I ) interactions.
The solution to Eqs. (37) and (38) has a physical meaning
5.2. Mathematical Model for the Formation of Precipitates
Let us consider a system of a growing undoped dislocation-free silicon single crystal. The concentrations of all point defects at the crystallization front are assumed to be equilibrium, and both the vacancies and the intrinsic interstitial silicon atoms are present in comparable concentrations [62]. During cooling of the crystal after passing through the diffusion zone, an excessive (nonequilibrium) concentration of intrinsic point defects appears. Excess intrinsic point defects disappear on sinks whose role in this process is played by uncontrollable (background) impurities of oxygen and carbon [14]. In real silicon crystals, the concentrations of carbon and oxygen impurities are higher than the concentrations of the intrinsic point defects. The formation of complexes between the intrinsic point defects and impurities is governed, on the one hand, by the fact that both the intrinsic point defects and the impurities are sources of internal stresses in the lattice (elastic interaction) and, on the other hand, by the Coulomb interaction between them (provided the defects and the impurities are present in the charged state). The mathematical model under consideration allows for the elastic interaction and the absence of the recombination of intrinsic point defects in the high-temperature range [44]. The concentrations of intrinsic point defects
Now, we consider the modern approach based on solving systems of coupled discrete differential equations of quasi-chemical reactions for the description of the initial stages of the formation of nuclei of new phases and a similar system of Fokker-Planck continuity differential equations. The grown-in microdefects are treated as clusters of particles of different types, so that their formation and decay can be represented as a reaction involving random processes of attachment and detachment of particles X ,
where Anis a cluster of the A type, which consist of n particles of the Xtype; g(n,r,t)is the growth rate of the An cluster and d(n,r,t)is the decay rate of the cluster. The concentration of the An clusters at the r point is determined by the function f(n,r,t) . The change of this function with time is described by the system of discrete kinetic differential equations
The conservation of the number of X particles is described by the equation
where nmaxis the maximum number of X particles contained in the Acluster.
By expanding the gradually n-dependent functions g,dand f into a Taylor series in terms to the second order included, the system of discrete equations is represented by the continuity partial differential equation (the Fokker-Planck equation) [63]
In this case, the flux of monomers in the space of n sizes is given by the formula
and the kinetic coefficients A and B are described by the expressions
When solving the system of equations (48) and (50), the fluxes J and I are joined at the point n=nmin . Then, the law of conservation of the number of particles (49) is transformed into the form
Equation (50) represents a diffusion drift equation that describes the evolution of the distribution function f in the space of n sizes. The system of equations (48)-(53) makes it possible within a unified model to consider the processes of nucleation and the subsequent growth of the clusters. The conventional boundary separating small and large clusters is considered to be n=nmin , which, in the calculations, is assumed to fall in the range from 10 to 20. This quantity represents the boundary between the range of sizes (n >min ) in which the thermodynamic approach to the description of the physical processes can be considered valid and the range of sizes (n<min) in which the atomic nature of these processes must be taken into account.
In order to describe the kinetics of the simultaneous nucleation and growth (dissolution) of a new phase particles of several types in a supersaturated solid solution of an impurity in silicon, it is necessary to consider a system consisting of oxygen and carbon atoms, vacancies, and intrinsic interstitial silicon atoms. The interaction in this system during cooling of the crystal from 1683 K results in the formation of oxygen and carbon precipitates [14]. In order to perform the computational experiments and to interpret their results, it is necessary to carry out a dimensional analysis of the kinetic equations and the conservation laws with the use of characteristic time constants and critical sizes of defects. This will make it possible to perform a comparative analysis of the joint evolution of oxygen and carbon precipitates and to optimize the computational algorithm for the numerical solution of the equations.
The nucleation and evolution of a complex system of grown-in microdefects (which consists of oxygen and carbon precipitates) during cooling of the crystal are described by the systems of coupled differential equations (48)-(53) for each type of defect. These systems are related by the laws of conservation of point defects, which determine the current values of their concentrations in the crystal and affect the rates of growth and dissolution of clusters of all types. For the case of a thin plane-parallel crystal plate of a large diameter, when the conditions in the plane parallel to the surface of the crystal can be considered to be uniform and the diffusion can be treated only along the normal to the surface (the z coordinate axis), the mass balance of point defects in the crystal is described by the system of diffusion equations for intrinsic interstitial silicon atoms, oxygen atoms, carbon atoms, and vacancies:
54
In the system of equations (54), we took into account that the oxygen precipitates serves as sinks for oxygen atoms and vacancies and as sources of interstitial silicon atoms. Then, we can write the following equations:
At the same time, the carbon precipitates, in turn, also serve as sinks for carbon atoms and interstitial silicon atoms and as sources for vacancies. Therefore, we can write
In the general case, the proportionality factors
The corresponding system of coupled Fokker-Planck equations can be transformed into the dimensionless form
where
The fluxes of particles on the right-hand sides of the system of equations (57) are described by the expressions
in which the following notation is used for the normalized kinetic coefficients:
The normalized rates of growth and dissolution of the precipitates in expressions (60) and (61) take the form
The critical size of the precipitates can be determined according to [64, 65] from the expressions
where
The number of impurity atoms in the compressed precipitates with the radii and is determined according to [65] from the formula
where is the volume of the precipitate; is the fraction of impurity atoms per intrinsic defect, ≤ 2, ≤ ½, ≤ ½.
When analyzing the evolution of precipitates during cooling of the crystal in the course of its growth, the important parameters are the characteristic constants in the size space: the critical sizes of the corresponding precipitates and the related characteristic time constants, which specify the scale of changes in the size distribution function of microdefects with time. The time constants in the system of equations (57) allow one to calculate the normalizing sizes
An increase in the supersaturations of point defects (oxygen and carbon atoms, intrinsic interstitial silicon atoms, and vacancies) leads to a decrease in the corresponding critical size of the precipitates and favors an acceleration of their growth. A decrease in the characteristic times also leads to an acceleration of the precipitation with an increase in the supersaturations of the point defects. The opposite trend is observed when the crystal is cooled from the crystallization temperature.
An important property of the characteristic times is their inverse proportionality to the products of the characteristics of point defects (diffusion coefficients and equilibrium concentrations):
Since the product of the characteristics of point defects for oxygen atoms considerably exceeds the analogous product for carbon atoms, the rate of evolution of the size distribution function of the carbon precipitates should exceed the corresponding rate for oxygen precipitates. This means that the evolution of the microdefect structure of dislocation-free silicon single crystal during cooling of the as-grown crystal is determined predominantly by the growth rate of the oxygen precipitates. Detailed quantitative information on the characteristics of the primary grown-in microdefects can be obtained by numerically calculating the system of equations (57).
The algorithm used for solving the problem of simulation of the simultaneous growth and dissolution of the oxygen and carbon precipitates due to the interaction of point defects during cooling of the crystal from the crystallization temperature is based on the monotonic explicit difference scheme of the first-order accuracy as applied to the Fokker-Planck equations (57). Detailed calculations are presented in the articles [59].
These calculations demonstrate that intrinsic point defects (vacancies and intrinsic interstitial silicon atoms) exert a significant influence on the dynamics of mass exchange and mass transfer of point defects between the oxygen and carbon precipitates. The absorption of vacancies by the growing oxygen precipitates leads to the emission of silicon atoms into interstitial positions. The intrinsic interstitial silicon atoms, in turn, interact with the growing carbon precipitates, which, in the process of growth, supply vacancies for growing oxygen precipitates. This interaction leads to such a situation that, first, the growth of the precipitates is suppressed more weakly because of the slower increase in the supersaturation of the intrinsic point defects in the bulk of the growing crystal and, second, the critical radius of the formation of carbon precipitates increases more slowly, which favors a more rapid growth of the carbon precipitates.
09-Headinigher rate of the evolution of the size distribution function for carbon precipitates can be associated with the higher mobility of interstitial silicon atoms as compared to vacancies in the high-temperature range. It can be assumed that the mutual formation and growth of oxygen and carbon precipitates result in a lower rate of the evolution of the size distribution function of the oxygen precipitates, regardless of their smaller critical size at the initial instant of time, owing to the effect of the carbon impurity.
The results of approximate calculations of the Fokker-Planck partial differential equations correlate well with the results of the analytical solution of the equations in the consistent model of dissociative diffusion in the approximation of strong complex formation [60]. The main advantage of these two models is that they complement each other. In particular, the critical size distribution functions of the oxygen and carbon precipitates can be found only from the Fokker-Planck continuity differential equations, whereas the consistent model of dissociative diffusion in the approximation of strong complex formation has failed to obtain these functions. At the same time, the model of dissociative diffusion makes it possible to analyze the processes occurring in the diffusion region near the crystallization front. Of special note is the fact that these mathematical models, together with the experimental results obtained from the investigation of quenched crystals, have demonstrated that the nucleation processes occur very rapidly near the crystallization front.
5.3. Model of Growth and Coalescence of Precipitates
In the classical theory of nucleation and growth of new-phase particles, the process of precipitation in a crystal is treated as a first-order phase transition and the kinetics of this process is divided into three stages: the formation of new-phase nuclei, the growth of clusters, and the coalescence stage.
At the second stage of the precipitation process, clusters grow without a change in their number. This growth is accompanied by a considerable decrease in the degree of supersaturation of the solid solution. It is assumed that the growth kinetics of precipitates is described by the reversible scheme AiC+A « Ai+1C , which corresponds to the growth of precipitates at the nucleation centers C with a concentration Nc that remains unchanged with time. The nucleation centers attach and detach monomers, which is described by the system of equations [66]:
where Ni is the volume-average concentration of nucleation centers that attach i particles, N is the monomer concentration, kiN is the rate of attachment of a monomer for a nucleation center, and is the rate of detachment of a monomer for a nucleation center. At the initial instant of time, the system contains only monomers and nucleation centers. The growth of precipitates is limited by the monomer diffusion. The kinetic coefficients are given by the formula ki4 π RiD, where is the radius of attachment of a free particle by a cluster consisting of i particles and D is the diffusion coefficient of a free particle.
The system of equations (67) obeys the law of conservation of nucleation centers
For i >> 1 the process is described using the Fokker-Planck equation. In accordance with the principle of detailed balance
where NE is the equilibrium concentration of monomers.
In the case of the diffusion-controlled precipitation, the mathematical expectation i(t) can be described by the macroscopic equation corresponding to expression (69) :
where k04πRiD, m is the initial size of precipitates, and is the parameter dependent on the cluster geometry.
Expressions (68) and (70) allow us to write the differential equation that describes the variation in the monomer concentration during the decomposition of the solid solution:
The kinetics of decrease in the monomer concentration, which is determined from the numerical solutions to the system of initial equations (67), coincides with that obtained from expression (71), to within the error of numerical methods. The solution of the system of initial equations (67) for real objects is nearly impossible due to the large dimension of the system of equations, whereas the solution of Eq. (71) presents no special problems [66].
The kinetics of decrease in the monomer concentration as a result of the decomposition of the solid solution at m=0 can be written in the form
By numerically solving Eq. (71) simultaneously with Eq. (68), we can calculated the average radius of the precipitate at the growth stage:
At the third stage of the precipitation process, when the particles of the new phase are sufficiently large, the supersaturation is relatively low, new particles are not formed and the decisive role is played by the coalescence, which is accompanied by the dissolution of small-sized particles and the growth of large-sized particles. The condition providing for changeover to the coalescence stage is the ratio
The precipitate grows at R(t)>Rcr(t) and dissolves at R(t)< Rcr(t). With time, the critical radius Rcr(t) increases and the number of particles per unit volume decreases [66]. The solution of the system of equations describing this process is possible only in the case where the supersaturation of the solute tends to zero.
Slezov and Kukushkin [67] showed that the crystallization of single-component melts is accompanied by the formation of temperature fields and that the precipitates of the new phase interact with each other through generalized temperature fields. The asymptotic solution to the system of equations describing this process is similar to the solution of the equations describing the diffusion isothermal coalescence [67] and becomes possible when the supercooling of the melt ΔT=Tc0 tends to zero (where Tc and T0 are the average and equilibrium temperatures of the crystal, respectively [67]).
Let us consider a solid solution that contains single-component spherical precipitates of a new phase with the initial size distribution function . The system containing the solid solution is thermally insulated and does not involve sources of a substance. Let the initial temperature and the initial concentration of the solid solution be Tc(0) andCc(0) , respectively. The solution is considered at the coalescence stage.
Since the system in which the solid solution decomposes is thermally insulated, the heat of the phase transition that releases in the course of the coalescence leads to an increase in the temperature of the entire system, which, in turn, leads to a change in the equilibrium concentration c [67]. In this case, the supersaturation will tend to zero more rapidly than in the case of isothermal coalescence, because the increase in the temperature results in an increase in the equilibrium concentration. This will lead to a decrease in the concentration gradient between the solution and the precipitation of the new phase, and, correspondingly, the growth rate of precipitates decreases. Consequently, the diffusion and thermal fields become self-consistent and the system of equations of the nonisothermal coalescence should involve both the mass balance equation and the heat balance equation. The system of equations describing the nonisothermal coalescence has the form [67]
where expression (74) is the equation of continuity in the space of sizes for the size distribution function of precipitates, expression (75) is the mass balance equation, expression (76) is the equation accounting for the amount of released heat, f0(R) is the initial size distribution function of precipitates, T0 is the initial temperature of the solid solution,
In order for the system of equations (74)-(76) to be complete, it is necessary to find the dependence of the growth rate of precipitates
Here, D is the diffusion coefficient for the component forming the new phase
with the boundary conditions [67]
where β is the specific boundary flux, which includes the rate of incorporation of the emission of atoms into the precipitate; CR is the concentration of atoms in equilibrium with the precipitate of radius R and c(R) is the concentration at the surface of the precipitate of the new phase. In the case of nonisothermal coalescence, the concentrations Cc,c(R),CR are functions of the temperature Tc . The equation for the growth rate of a precipitate is obtained by solving Eq. (12) with the boundary conditions (79):
where is the equilibrium concentration of the solute at the temperature and is the surface tension at the interface between the precipitate of the new phase and the solid solution. It follows from expression (80) that there are two possible processes limiting the growth rate of the precipitate [67].
(1) The diffusion processes for D<<β:nR
(2) The processes occurring at the precipitate boundary for : D>>βnR;:
Equations (74)-(76) with either expression (81) or expression (82) form the complete system of equations that describe the process of nonisothermal decomposition of the solid solution at the stage of the coalescence. Slezov and Kukushkin [67] showed that, in closed systems in the absence of sources (sinks) of heat and matter, the dependences of the variations in the distribution functions for precipitates of the new phase over the sizes, their density, and the critical and average radii in the case of nonisothermal coalescence are identical to those observed in the case of isothermal coalescence. Only the constants dependent on the temperature are changed. Equations (74)-(76), together with either expression (81) or expression (82), are solved using the method developed in [67]. In the general case, the size distribution function for precipitates has the following form:
The average size of precipitates at the stage of the coalescence is proportional to the cube root of time [67]:
where D(t) is the diffusion coefficient of impurity atoms,
Here,t0 is the initial critical time and Nc is the initial concentration of precipitates.
Detailed calculations are presented in the articles [66]. The analysis was carried out under the assumption that precipitates grow at a fixed number of nucleation centers according to the diffusion mechanism of growth. The model corresponds to the precipitation uniform in the volume. An analysis of the results obtained and the data taken from [57, 59] has demonstrated that the phase transition occurs according to the mechanism of nucleation and growth of a new phase so that these two processes are not separated in time and proceed in parallel.
The condition providing changeover to the stage of the coalescence is written in the form R(t)≈Rcr(t), which is satisfied for large-sized crystals at the temperature T ≈ 1423 K. Taking into account the computational errors, this temperature for large-sized crystals corresponds to the initial point of the range of the formation of microvoids (at Vg = 0.6 mm/min). In this range, all impurities are bound and there arises a supersaturation with respect to vacancies, which is removed as a result of the formation of microvoids. With a change in the thermal conditions of the growth (for example, at Vg = 0.3 mm/min [10]), there arises a supersaturation with respect to interstitial silicon atoms, which leads to the formation of interstitial dislocation loops. In this case, the condition R(t)≈Rcr(t) is satisfied at T ≈ 1418 K. Consequently, the stage of the coalescence in large-sized silicon single crystals begins at temperatures close to the temperatures of the formation of clusters of intrinsic point defects (depending on the thermal growth conditions, these are microvoids or interstitial dislocation loops).
The simultaneous nucleation and growth of particles of the new phase (oxygen and carbon precipitates) during cooling of as-grown silicon crystals leads to a strong interplay between the processes of evolution of these two subsystems of grown-in microdefects. The absorption of vacancies by growing oxygen precipitates results in the emission of silicon atoms in interstitial sites. In turn, the intrinsic interstitial silicon atoms interact with growing carbon precipitates, which, in the course of their growth, supply vacancies for growing oxygen precipitates. This interplay between the processes leads to an accelerated changeover of the subsystems of oxygen and carbon precipitates to the stage of the coalescence as compared to the independent evolution of these two subsystems.
The change in the thermal conditions for the growth of small-sized FZ-Si single crystals (high growth rates and axial temperature gradients) leads to the fact that the stage of the coalescence begins far in advance (at T ≈Tm-20K). The results of theoretical calculations have demonstrated that a decrease in the concentrations of oxygen and carbon in small-sized single crystals leads to a further decrease in the time of occurrence of the growth stage of precipitates. The change in thermal conditions of crystal growth (in particular, an increase in the growth rate and in the axial temperature gradient in the crystal) substantially affects the stage of the growth of precipitates. In turn, the decrease in the time of occurrence of the growth stage of precipitates is associated, to a lesser extent, with the decrease in the concentration of impurities in crystals. Eventually, these factors are responsible for the decrease in the average size of the precipitates.
Kinetic model of decomposition of solid solutions of oxygen and carbon impurities not only allows one to simulate the processes of precipitation during cooling of the as-grown silicon crystal to a temperature of 300 K but also adequately describes the available experimental data on the oxygen and carbon precipitation. The kinetic model of growth and coalescence of oxygen and carbon precipitates in combination with the kinetic models describing their formation [57, 59] represents a unified model of the process of precipitation in dislocation-free silicon single crystals. In the future, the mathematical apparatus of this model will make it possible to take into account and analyze interactions of intrinsic point defects not only with oxygen and carbon background impurities but also with other impurities (for example, transition metals, nitrogen, hydrogen, etc.), as well as interactions of the impurity-impurity type.
6. DIFFUSION KINETIC OF FORMATION OF THE MICROVOIDS AND INTERSTITIAL DISLOCATION LOOPS
As mentioned earlier the defect formation processes in a semiconductor crystal, in general, and in silicon, in particular, have been described using the model of point defect dynamics; in this case, the crystal has been considered a dynamic system and real boundary conditions have been specified [10, 41-43, 45]. The mathematical model of point defect dynamics in silicon quantitatively explains the homogeneous mechanism of formation of microvoids and interstitial dislocation loops and provides the basis for the understanding of the relation between the defect crystal structure and the processes occurring in the melt [10].
However, the model of point defect dynamics has not been used for calculating the formation of interstitial dislocation loops and microvoids under the assumption that the recombination of intrinsic point defects is absent in the vicinity of the crystallization front. This fact is evidenced by experimental and theoretical investigations [14, 44].
6.1 Kinetics of Formation of Microvoids
The experimentally determined temperature range of the formation of microvoids in crystals with a large diameter is 1403…1343 K [34]. In this respect, the approximate calculations for the solution in terms of the model of point defect dynamics were performed at temperatures in the range 1403…1073 K. The computational model uses the classical theory of nucleation and formation of stable clusters and, in strict sense, represents the size distribution of clusters (microvoids) reasoning from the time process of their formation and previous history.
The system of equations is solved using the exact space-time discretization. The algorithm involves the solution to the equation
In the high-temperature range (1682 K <T <1403 K, the growth parameter is Vg/G >crit), there occur nucleation and growth of impurity precipitates [14]. In this range, the supersaturation of intrinsic point defects (vacancies) is low and, hence, the nucleation rate of microvoids is negligible. At T≤ 1403 K, the supersaturation increases, which leads to an increase in the nucleation rate of microvoids. After the formation of microvoids, their growth is accompanied by a rapid consumption of vacancies. As a result, the supersaturation decreases and the nucleation rate of microvoids decreases drastically. The nucleation dominates in a narrow temperature range, and, therefore, the nucleation of microvoids outside the zone of their formation is ignored. Moreover, since the growth rate of microvoids decreases sharply with an increase in their size and the corresponding decrease in the vacancy concentration, the growth of microvoids outside the nucleation zone is also disregarded.
The calculations were carried out in the framework of the model of point defect dynamics, i.e., for the same crystals with the same parameters as in already the classical work on the simulation of microvoids and interstitial dislocation loops (A-microdefects) [10]. According to the analysis of the modern temperature fields used when growing crystals by the Czochralski method, the temperature gradient was taken to be G = 2.5 K/mm [10]. The simulation was performed for crystals 150 mm in diameter, which were grown at the rates Vg= 0.6 and 0.7 mm/min. These growth conditions correspond to the growth parameter Vg/ G > ξcrit.
Detailed calculations are presented in the articles [68]. Our results somewhat differ from those obtained in [10]. These differences are as follows: (i) the nucleation rate of microvoids at the initial stage of their formation is low and weakly increases with a decrease in the temperature and (ii) a sharp increase in the nucleation rate, which determines the nucleation temperature, occurs at a temperature T~ 1333 K. These differences result from the fact that the recombination factor in our calculations was taken to be k1V=0 . For k1V≠0 , consideration of the interaction between impurities and intrinsic point defects in the high-temperature range becomes impossible, which is accepted by the authors of the model of point defect dynamics [10]. In this case, in terms of the model, there arises a contradiction between the calculations using the mathematical model and the real physical system, which manifests itself in the ignoring of the precipitation process [10].
An increase in the crystal growth rate only insignificantly decreases the critical pore radius and weakly affects the nucleation temperature. As is known, in order to prevent the formation of microvoids, the cooling rate should be increased above 40 K/min [69]. These conditions are fulfilled when growing small-sized silicon crystals. For real growth rates of large-sized single crystals (with a diameter of larger than 80 mm), the formation of microvoids cannot be suppressed [70].
6.2. Kinetics of Formation of Interstitial Dislocation Loops (A-Microdefects)
The computational experiment was performed similarly to the calculations of the formation of microvoids. The simulation was performed for crystals 150 mm in diameter, which were grown at the rates Vg= 0.10 and 0.25 mm/min for the temperature gradient G = 2.5 K/mm. These growth conditions correspond to the growth parameter Vg/ G < ξcrit.
With allowance made for the experimental data on the range of the formation of A-microdefects, the calculations were carried in the range from 1223 to 1023 K [10]. It is assumed that, in the high-temperature range (1682 K < T < 1223 K, the growth parameter is Vg/ G < ξ crit), there occur nucleation and growth of impurity precipitates. In this range, the supersaturation of intrinsic point defects (intrinsic interstitial silicon atoms) is low and, hence, the nucleation rate of A-microdefects is negligible. At T≤ 1223 K, the supersaturation increases, which leads to an increase in the nucleation rate of A-microdefects. After the formation of A-microdefects, their growth is accompanied by a rapid consumption of intrinsic interstitial silicon atoms. As a result, the supersaturation decreases and the nucleation rate of A-microdefects decrease drastically. Consequently, the nucleation dominates in a narrow temperature range, and, therefore, the nucleation of A-microdefects outside the zone of their formation is ignored. Moreover, since the growth rate of A-microdefects decreases sharply with an increase in their size and the corresponding decrease in the concentration of intrinsic interstitial silicon atoms, the growth of A-microdefects outside the nucleation zone is also disregarded.
Detailed calculations are presented in the articles [68]. The temperature of the formation of A-microdefects corresponds to ~1153 K. An increase in the crystal growth rate weakly decreases the critical radius of A-microdefects and slightly affects the nucleation temperature. An increase in the crystal growth rate leads to an almost twofold decrease in the concentration of introduced defects.
The data of the computational experiment on the determination of the microvoid concentration correlate well with the experimentally observed results (104-105 cm-3) [36]. For the A-microdefects, for which the concentration according to the experimental data is ~106…107 cm-3 [14], the discrepancy is as large as three orders of magnitude. This can be explained by the fact that, unlike microvoids, which are formed only through the coagulation mechanism, the formation of A-microdefects occurs according to both the coagulation mechanism and the mechanism of prismatic extrusion (deformation mechanism) [14]. The results of the calculations suggest that the main contribution to the formation of A-microdefects is made by the mechanism of prismatic extrusion when the formation of interstitial dislocation loops is associated with the relieving of stresses around the growing precipitate. Consequently, the impurity precipitation processes that proceed during cooling of the crystal from the crystallization temperature are fundamental (primary) in character and determine the overall defect formation process in the growth of dislocation-free silicon single crystals.
The calculations of the formation of microvoids and interstitial dislocation loops (A-microdefects) demonstrated that the above assumptions do not lead to substantial differences from the results of the previous calculations in terms of the model of point defect dynamics. This circumstance indicates that the mathematical model of point defect dynamics can be adequately used on the basis of the physical model in which the impurity precipitation process occurs before the formation of microvoids or interstitial dislocation loops. Consequently, the model of the dynamics of point defects can be considered as component part of the diffusion model for formation grown-in microdefects. Moreover, the significant result of the calculations is the confirmation of the coagulation mechanism of the formation of microvoids and the deformation mechanism of the formation of interstitial dislocation loops.
6.3. Model of the Vacancy Coalescence
We have proposed a new alternative mathematical model of formation secondary grown-in microdefects (microvoids) in dislocation-free silicon single crystals. It is shown that microvoids are formed in a narrow temperature range of 1403…1343 К [70]. This is caused by a sharp decrease in the concentration of background impurity which does not form agglomerates (they arise in the temperature range of 1683…1423 K upon crystal cooling [59]).
This model explains the excess of nonequilibrium vacancies upon crystal cooling during growth and the absence of microvoids in crystals with small diameters. A possible reason for the excess of nonequilibrium vacancies is the bonding of oxygen atoms into grown-in microdefects ((I+V)-microdefects) with a decrease in temperature to T <1423 K. Under such conditions, the decay of the supersaturated solution of vacancies and vacancy diffusion occur simultaneously in the first stage. When most vacancies are spent on the microvoid formation and the concentration of nonequilibrium vacancies becomes fairly low, the diffusion of the remaining nonequilibrium vacancies to the surface and into the bulk of the crystal is accompanied by microvoid coalescence. When this second stage is over, all excess vacancies emerge on the crystal surface [70].
In the first stage, this system can be described by the equations [70]:
where n is the nonequilibrium-vacancy concentration, is the vacancy diffusion coefficient, r is the microvoid radius, NL is the vacancy concentration in a microvoid (or inverse volume per vacancy), and N is the experimentally observed microvoid concentration [34].
The boundary and initial conditions have the form
The condition
To solve the problem for the first stage, we will substitute (88) into (87), integrate over time, and introduce new variables:
where
In this case, Eqs. (87) and (88) become dimensionless:
where
with the boundary and initial conditions
The first stage duration q1 depends on the drift time of most excess vacancies to pores, which is found from Eq. (90) with the exclusion of the diffusion term
The stationary profile pores after the first stage
with the boundary conditions
where
q Δ,q maxare determined from the equation
The duration of the second stage (pore coalescence) can be estimated using the expression for the coalescence characteristic time,
where s is the surface tension at the crystal/vacuum interface, R is the void radius, Ω is the volume per vacancy and is the equilibrium void concentration.
When the impurity diffuses throughout the crystal, it decorates the vacancy profile if the time it takes to pass the distanceδ(timp) is shorter than tII . Therefore, the condition for impurity profile formation has the form
where Dimp is the impurity diffusion coefficient.
Detailed calculations are presented in the articles [70]. The estimation of the characteristic times of the first and second stages, which is performed for the temperature range of microvoid formation, showed that the relation t1<<tS<<tII is satisfied. Hence, one can unambiguously conclude that a quasi-stationary pore profile is formed during silicon crystal growth if an excess vacancy concentration arises in the range of crystal cooling from 1403 to 1343 K. The conditions for decorating microvoids by background carbon and oxygen impurities (100) in the temperature range of 1343…1173 К [34, 36] are satisfied well. Our results confirm that an increase in temperature reduces the probability for decorating the pore profile by impurity.
When stating the problem, we disregarded the vacancy drain to the lateral crystal surface. The lateral surface limits the conditions for forming microvoids in the crystal cross section from below:dmin2 > δ . Therefore, under certain temperature conditions, microvoids should be formed in real commercial single crystals during growth if the crystal diameter exceeds 80 mm.
The fundamental interaction between impurities and intrinsic point defects upon crystal cooling under certain thermal conditions ( T < 1423 K ) leads to impurity depletion and the formation of a supersaturated solid solution of intrinsic point defects. The decay of this supersaturated solid solution causes the coagulation of intrinsic point defects in the form of microvoids or interstitial dislocation loops in different regions of the crystal.
An analysis of the experimental and calculated data within model of the vacancy coalescence in accordance with
the heterogeneous diffusion model of the formation of grown-in microdefects revealed the following reasons for the occurrence of microvoids in dislocation-free silicon single crystals:
(i) a sharp decrease in the concentration of background impurity that was not associated into impurity agglomerates (formed in the cooling range of 1683…1423 К);
(ii) a large (over 80 mm) crystal diameter (in this case vacancies fail to drain from the central part of the crystal to the lateral surface);
(iii) crystals of large diameter generally contain a ring of D-microdefects which forms due to the emergence of the (111) face on the crystallization front and which depletes the region inside with impurity atoms.
The growth parameter Vg/G describes the fundamental reasons related to the systematic nonuniform impurity distribution during crystal growth from a melt. Based on an analysis of the experimental results, one can suggest that the parameter Vg/G controls the growth because it describes the condition for the emergence of the (111) face at the crystallization front. Therefore, the impurity depletion inside the ring of D-microdefects upon crystal cooling at T < 1423 K is caused by two things: the impurity bonding during the formation of primary grown-in microdefects ((I+V)-microdefects) and the impurity drift to the (111) face, which is equivalent to the annular distribution of primary D-type grown-in microdefects. In this case, excess vacancies arise within the ring of D-microdefects to form a supersaturated solid solution with its subsequent decay and the formation of vacancy microvoids. In contrast, excess silicon self-interstitials arise beyond the D-ring to form a supersaturated solid solution with its subsequent decay and the formation of interstitial dislocation loops (А-microdefects) [70].
6.4. Kinetic Model for the Formation and Growth of Interstitial Dislocation Loops
Kinetics of high-temperature precipitation involves three stages: (i) the nucleation of a new phase, (ii) the growth stage and (iii) the stage coalescence. Precipitates are formed in the crystal due to elastic interaction of point defects. They are present in a coherent elastically deformed state when the lattice distortion near the interface between precipitate-matrix are small and one atom of the precipitate corresponds to one atom of the matrix [71]. Elastic deformation and associated mechanical stresses are responsible for the transfer of excess (missing) of a substance from the precipitate or to him. Accumulation of elastic energy during the growth of precipitate causes a loss of coherence with the matrix. In this case, it is impossible to establish one-one correspondence between atoms on opposite sides of the interface. This process leads to structural relaxation of precipitates. Structural relaxation of precipitates occurs through the formation and movement of dislocation loops.
To simulate the stress state of the precipitate and the surrounding matrix is sufficient to investigate the simplest spherical precipitate. For a spherical precipitate solution can be found in analytic form [72]. As the initial model, we take the theoretical and experimental research of stress relaxation of bulk quantum dots [73-76]. In accordance with these ideas during the growth of precipitate its elastic field causes the formation of circular interstitial dislocation loop. This process helps to reduce the total elastic energy of the system. Growing precipitate displaces the matrix material. Interstitial atoms form interstitial dislocation loop near a precipitate. Simultaneously on the precipitate are formed loop of misfit dislocation [76]. In this case the critical size of precipitates, at which is energetically favorable for the formation of dislocations have the same order with the critical size of dislocation loops [76].
In the bulk of silicon a precipitate creates a stress field due to the mismatch of lattice parameters of precipitate (a1) and the surrounding matrix (a2) [76]. Then the own deformation of precipitate is defined as
In general, the characteristic deformation of precipitate in the bulk of the matrix can be written in the form
where the diagonal terms is dilated mismatch of crystal lattices of the precipitate and the matrix; the rest terms is the shear components
Consider the simplest model of a spherical precipitate with equiaxed own deformation
where J is the shear modulus n is the Poisson's ratio. From a certain critical radius Rcrit takes effect mechanism for resetting the elastic energy of the precipitate. This mechanism leads to the formation of circular interstitial dislocation loop [76]. Energy criterion of this mechanism is the condition Einitial≥ Efinal,here Einitial ,Efinal is the elastic energy of the system with the precipitate before and after relaxation, respectively [76].
In the case of a spherical precipitate with equiaxed own deformation calculation of the elastic fields precipitate is greatly simplified. Assume that the own elastic energy of the precipitate before and after the formation of loop of misfit dislocation remains constant
To estimate believe that loop of misfit dislocation is the equatorial location on the spheroidal precipitate RD=Rpr the self-energy prismatic loop [76]
where f is the radius of the core loop; b is the magnitude of the Burgers vector. The critical radius of precipitate for the formation of dislocation loop is determined from the expression [76]
where α is a constant contribution of the dislocation core. Expression (105) is approximate and can only be used to determine the value critical radiusRcrit .
In [77] considered theoretically the kinetics of coarsening of dislocation loops on the stages of growth and coalescence of loops. It is assumed that, in general, growth is controlled by or an energy barrier at the capture loop of atom or the activation energy of diffusion of an interstitial atom. When the crystal is cooled after growth, we assume that the decisive role played by the processes of diffusion. Further, in calculating the evolution of the distribution of loop size and evolution density of loop model is used [78].
At the stage of coalescence of dislocation loops with a radius R > Rcrit will grow in size, while small dislocation loops with a radius R < Rcrit will dissolve [77, 78]. The growth of dislocation loops during cooling after the growth of single crystal silicon occurs as due to dissolution of small loops with sizes less than critical, and as a result supersaturation for intrinsic interstitial silicon atoms. Growth conditions correspond to the parameter
where D(t) is the diffusion coefficient of intrinsic interstitial silicon atoms; t is the time cooling the crystal; j is the proportionality factor. The value of the cooling time of the crystal is determined from the dependence:
where M(t) is the concentration of precipitates.
High-temperature precipitation of background impurities of oxygen and carbon as a result of their elastic interaction with intrinsic point defects is a fundamental process. This process is determines the defect structure of dislocation-free silicon single crystal and many important properties of silicon devices. By analyzing the electron-microscopic data on the investigation of precipitates in silicon single crystals obtained at different growth conditions we can talk about: (i) coherent precipitates, which do not contain next to of dislocation defect; (ii) precipitates with single dislocation loops; (iii) precipitates with multiple dislocation loops [14]. Initially precipitates impede processes of propagation and reproduction of dislocation loops. Then precipitates contribute to the formation of dislocation loops by the action sources of the Bardeen-Herring or the Frank-Read. These processes lead to the formation and growth of complex dislocation loops. Growth and coalescence of dislocation loops is provided by the generation of interstitial silicon atoms growing precipitates and dissolution of small dislocation loops. If the parameter of crystal growth
CONCLUSION
The most fruitful approach to the problem of defect formation in dislocation-free silicon single crystals is to combine numerous experimental investigations and an analysis of the data obtained with the development of mathematical models of the grown-in microdefect formation based on these data. A diffusion model of the formation grown-in microdefects are based on the physical classification of these microdefects, the heterogeneous mechanism by which they form, and mathematical models of the formation of primary and secondary grown-in microdefects. The diffusion model provides the unity and adequacy of physical and mathematical modeling. The model of the dynamics of point defects can be considered as component part of the diffusion model for formation grown-in microdefects
The main feature of the diffusion model is the dependence of the parameters of all types of grown-in microdefects (e.g., size and concentration of the precipitates, loops and microvoids) from the thermal conditions of crystal growth. This feature allows calculating the initial defective structure of dislocation-free silicon single crystals of any diameter, obtained by the Czochralski method and floating zone melting. The diffusion model gives practical levers of management the defect structure of dislocation-free silicon single crystals directly during crystal growth. Appears a real possibility to link together the processes occurring in the melt, with the real physical processes of formation defects in the crystal during its cooling.
Diffusion model of formation grown-in microdefects is the key to solving the problem of formation of the defect structure during the manufacture of discrete devices and integrated circuits based on silicon. The transformation of the original defect structure after various technological actions can be described on the basis of methods and approaches the diffusion model. Then it will be possible to link together the processes of formation of grown-in microdefects and postgrowth microdefects and to develop real production operations for the defect engineering.
Diffusion model of formation grown-in microdefects answers the questions of interaction of point defects during crystal growth and to explains the initial defective structure of the crystal. It can serve as a basis for considering the formation of defects in other semiconductor crystals.
From our point of view of future research of the defect structure of dislocation-free silicon single crystals should:
consider the influence of other impurities (e.g., dopants, nitrogen, hydrogen, iron, and others) on the formation of the defect structure of silicon;
use improved methods of approximate calculations;
to carry out the development of 2D and 3D versions of the diffusion model of formation grown-in microdefects;
to carry out the development of software products based on the diffusion model in combination with known software products for modeling crystal growth;
use approaches and methods of diffusion model for modeling the formation of postgrowth microdefects after technological exposure (e.g., thermal and radiation treatments) and etc.
CONFLICT OF INTEREST
None declared.
ACKNOWLEDGMENT
None declared.
REFERENCES
Endorsements
Table of Contents
- INTRODUCTION
- CLASSIFICATION OF GROWN-IN MICRO-DEFECTS: EXPERIMENTAL RESEARCHES OF GROWN-IN MICRODEFECTS IN DISLOCATION-FREE SILICON SINGLE CRYSTALS
- THE MODELING FORMATION OF THE GROWN-IN MICRODEFECTS
- THE TWO-STAGE MECHANISM FOR THE FORMATION AND TRANSFORMATION OF GROWN-IN MICRODEFECTS (HETEROGENEOUS MECHANISM)
- DIFFUSION KINETIC OF HIGH-TEMPERATURE PRECIPITATION
- DIFFUSION KINETIC OF FORMATION OF THE MICROVOIDS AND INTERSTITIAL DISLOCATION LOOPS
- CONCLUSION
- CONFLICT OF INTEREST