- Home
- About Journals
-
Information for Authors/ReviewersEditorial Policies
Publication Fee
Publication Cycle - Process Flowchart
Online Manuscript Submission and Tracking System
Publishing Ethics and Rectitude
Authorship
Author Benefits
Reviewer Guidelines
Guest Editor Guidelines
Peer Review Workflow
Quick Track Option
Copyediting Services
Bentham Open Membership
Bentham Open Advisory Board
Archiving Policies
Fabricating and Stating False Information
Post Publication Discussions and Corrections
Editorial Management
Advertise With Us
Funding Agencies
Rate List
Kudos
General FAQs
Special Fee Waivers and Discounts
- Contact
- Help
- About Us
- Search


The Open Atmospheric Science Journal
(Discontinued)
ISSN: 1874-2823 ― Volume 14, 2020
Modeling Current and Future Climate Change in the UAE using Various GCMs in MarksimGCMR
Latifa Saeed Al Blooshi1, Sofyan Alyan1, Ngaina Joshua Joshua2, Taoufik Saleh Ksiksi1, *
Abstract
Introduction:
Changes in climate have impacts on natural and human systems on all continents and across the oceans. Most countries, including the UAE, are expected to experience a huge impact of climate change, due to the undergoing rapid growth and huge urban developments.
Materials & Methods:
Representative Concentration Pathways, or RCPs, represent the latest generation of scenarios that are used as potential inputs into climate models to show imposed greenhouse-gas concentration pathways during the 21st century. Four emission scenarios have been used for climate research; namely RCP 2.6, RCP 4.5 and RCP 6 and RCP 8.5. RCP 4.5 and RCP 8.5 are used. The aims of this study are to assess different RCPs and their appropriateness to predict temperatures and rainfall and to study the effect of climate change on three different cities in the UAE.
Results & Conclusion:
The results show a strong correlation between the present Tmax vs Tmax 2020, Tmax 2040, Tmax 2060, Tmax 2080 and Tmax 2095 for both RCP4.5 and RCP8.5. This means that maximum temperatures are going to increase in the coming years based on the predictions according to the different scenarios using MarksimGCMR.
Precipitation projections shows greater variation than temperature. In this paper the amount of increase in temperatures and precipitation change is shown for the end of the current century.
Article Information

Identifiers and Pagination:
Year: 2019Volume: 13
First Page: 56
Last Page: 64
Publisher Id: TOASCJ-13-56
DOI: 10.2174/1874282301913010056
Article History:
Received Date: 08/03/2019Revision Received Date: 12/11/2019
Acceptance Date: 15/11/2019
Electronic publication date: 20/12/2019
open-access license: This is an open access article distributed under the terms of the Creative Commons Attribution 4.0 International Public License (CC-BY 4.0), a copy of which is available at: https://creativecommons.org/licenses/by/4.0/legalcode. This license permits unrestricted use, distribution, and reproduction in any medium, provided the original author and source are credited.
* Address correspondence to this author at the Biology Department - UAE University - Al-Ain - UAE; Tel: +971507132808; E-mail: tksiksi@uaeu.ac.ae
| Open Peer Review Details | |||
|---|---|---|---|
| Manuscript submitted on 08-03-2019 |
Original Manuscript | Modeling Current and Future Climate Change in the UAE using Various GCMs in MarksimGCMR | |
1. INTRODUCTION
In recent decades, changes in climate have caused impacts on natural and human systems on all continents and across the oceans [1Stocker T. Climate change 2013: the physical science basis: Working Group I contribution to the Fifth assessment report of the Intergovernmental Panel on Climate Change 2014.]. The United Arab Emirates (UAE) and the Arabian Gulf region are no exception. The UAE, covering an area of 83000 Km2, with extended coastlines and small islands, is consequently more prone to the impact of climate change especially that it is also undergoing rapid growth and huge urban developments [2Yearbook UAE. Ministry of information and culture 2010.]. The UAE population is in a steady rise and its climate is changing like everywhere else, with the increase of atmospheric CO2 and temperature and the abnorm-alities in rainfall events [3Dougherty B, Fencl A, Swartz C, Fisher J, Osman B, Yates D. Climate Change Impacts 2009.]. In Abu Dhabi, by 2050, the average temperature will increase by around 2.5°C, while rainfall will change by between -21.2% and +10.3% using General Circulation Models (GCM) [3Dougherty B, Fencl A, Swartz C, Fisher J, Osman B, Yates D. Climate Change Impacts 2009.].
GCMs are numerical models predicting atmospheric physical processes, ocean dynamics and land surface processes, while presenting the most advanced predictive tools available to simulate the impact of increased greenhouse gas levels on the global climate system [4Chen H, Xu CY, Guo S. Comparison and evaluation of multiple gcms, statistical downscaling and hydrological models in the study of climate change impacts on runoff. J Hydrol (Amst) 2012; 434: 36-45.
[http://dx.doi.org/10.1016/j.jhydrol.2012.02.040] ]. Relying on such models, the Intergovernmental Panel on Climate Change (IPCC) reported that the last three decades were consistently warmer than any preceding decade since 1850 [1Stocker T. Climate change 2013: the physical science basis: Working Group I contribution to the Fifth assessment report of the Intergovernmental Panel on Climate Change 2014.]. Consequently, some low-lying regions and islands are required to confront high impacts that could have a cost as much as several percent points GDP [1Stocker T. Climate change 2013: the physical science basis: Working Group I contribution to the Fifth assessment report of the Intergovernmental Panel on Climate Change 2014.]. Unfortunately, this recent impact of climate change may have far reaching negative impacts. The combination of water shortages and high population growth rates accelerate the risks of the Middle East to future climate change [5Evans JP. 21st century climate change in the middle east. Clim Change 2009; 92: 417-32.
[http://dx.doi.org/10.1007/s10584-008-9438-5] ]. Simulations results reported by [6Cramer W, Bondeau A, Woodward FI, et al. Global response of terrestrial ecosystem structure and function to co2 and climate change: results from six dynamic global vegetation models. Glob Change Biol 2001; 7: 357-73.
[http://dx.doi.org/10.1046/j.1365-2486.2001.00383.x] ] reveal large magnitude of possible biospheric influences of climate change. Biodiversity, coral species, coastal sustainability and water resources could be affected by climate change in the UAE [3Dougherty B, Fencl A, Swartz C, Fisher J, Osman B, Yates D. Climate Change Impacts 2009.].
The urgency of climate adaptations and mitigations require the use of these types of models to predict the impact of climate change [7Merryfield WJ, Lee WS, Boer GJ, et al. The canadian seasonal to interannual prediction system. part i: Models and initialization. Mon Weather Rev 2013; 141: 2910-45.
[http://dx.doi.org/10.1175/MWR-D-12-00216.1] ]. GCMs are known to produce hypothesis-based predictions relying on well-established and demonstrated physical principles [8Randall DA, Wood RA, Bony S, et al. Climate models and their evaluation.Climate change 2007: The physical science basis Contribution of Working Group I to the Fourth Assessment Report of the IPCC (FAR) 2007; 589-662.]. Randall and Colleagues also added that the confidence in these models have become stronger and provide credible outcomes. Care is to be taken as some components of climate may be poorly simulated which leads to problems in interpretations of results from such models [9Lin JL, Kiladis GN, Mapes BE, et al. Tropical intraseasonal variability in 14 ipcc ar4 climate models. Part i: Convective signals. J Clim 2006; 19: 2665-90.
[http://dx.doi.org/10.1175/JCLI3735.1] ]. Nevertheless, in a study on the impact of climate change in the Middle East using 18 GCMs [5Evans JP. 21st century climate change in the middle east. Clim Change 2009; 92: 417-32.
[http://dx.doi.org/10.1007/s10584-008-9438-5] ], reported that the models predict an overall temperature increase of between 1.4 to 4°C. He also added that the smallest increases occur over the large water bodies. Red Sea and Arabian Gulf are estimated to have the more considerable change in temperatures. While the largest increases will be felt over land masses, away from water bodies [5Evans JP. 21st century climate change in the middle east. Clim Change 2009; 92: 417-32.
[http://dx.doi.org/10.1007/s10584-008-9438-5] ]. On a more recent time scale [10Feulner GR. Rainfall and climate records from sharjah airport: Historical data for the study of recent climatic periodicity in the uae. Tribulus (Abu Dhabi) 2006; 16: 3-9.], reported that for Sharjah, the annual rainfall totals are very periodic, with June begin the driest month. He added that the years 2000-2003 had the lowest 4-year rainfall total, while 1995-1998 was the wettest period. For other Gulf countries, such as Saudi Arabia, rainfall was noted to decrease by about 48 mm per decade [11Almazroui M, Nazrul Islam M, Athar H, Jones P, Rahman MA. Recent climate change in the arabian peninsula: annual rainfall and temperature analysis of saudi arabia for 1978–2009. Int J Climatol 2012; 32: 953-66.
[http://dx.doi.org/10.1002/joc.3446] ]. While the mean temperature increase by 0.60°C per decade.
Fortunately, in preparation for the Intergovernmental Panel on Climate Change (IPCC) Fourth Assessment Report (AR4), many international climate modeling centers assessed long-term simulations of climate change scenarios [9Lin JL, Kiladis GN, Mapes BE, et al. Tropical intraseasonal variability in 14 ipcc ar4 climate models. Part i: Convective signals. J Clim 2006; 19: 2665-90.
[http://dx.doi.org/10.1175/JCLI3735.1] ]. Rigorous evaluation were used for all models to improve their predictions [9Lin JL, Kiladis GN, Mapes BE, et al. Tropical intraseasonal variability in 14 ipcc ar4 climate models. Part i: Convective signals. J Clim 2006; 19: 2665-90.
[http://dx.doi.org/10.1175/JCLI3735.1] ]. But the problem of linking large scale GCM to finer regional models still poses a challenge [12G.J.. Regional climate modelling. Meteorology and Atmospheric Physics 1997; 63: 105-17.]. Such spatial linkages are the best approach to produce more reliable predictions at regional levels.
RegCM, for instance, is part of network of collaborative modeling projects to improve predictions and understanding of climate change at regional scales [13Giorgi F, Coppola E, Solmon F, et al. Regcm4: model description and preliminary tests over multiple cordex domains. Clim Res 2012; 52: 7-29.
[http://dx.doi.org/10.3354/cr01018] ]. For many to use reliable predictive models, emission scenarios of climate change are to be assessed.
The GCMs are applied to measure the 21st century climate change over the UAE and Arabian Gulf region [14Yates D, Monaghan A, Steinhoff D. Regional atmospheric modeling for the arabian gulf region–future scenarios and capacity building final technical report for agedis local national and regional climate change programme 2015.] implemented simulations using version 3.5.1 of the Weather Research and Forecasting Model (WRF).
Which is a fully compressible conservative-form that is able to resolve small-scale The recent insufficiencies of GCMs and the fact that each model has strengths and weaknesses has led to a conclusion that no single model can be considered best [15Kiwan MK, Kabshawi MM, Qarqaz MM, et al. Climate change impacts, vulnerability adaptation 2009.]. Results should be utilized from a range of coupled models for adaptation studies as well as regional impact [16Agedi, 2017. AGEDI 2017. Sea level Rise Primer. Technical Report. EAD. Allen, M.R., Stott, P.A., Mitchell, J.F., Schnur, R., Delworth, T.L., 2000. Quantifying the uncertainty in forecasts of anthropogenic climate change. Nature 407: 617., 17Tebaldi C, Smith RL, Nychka D, Mearns LO. Quantifying uncertainty in projections of regional climate change: A bayesian approach to the analysis of multimodel ensembles. J Clim 2005; 18: 1524-40.
[http://dx.doi.org/10.1175/JCLI3363.1] ] used a statistical model that combines information from each GCM, including each models ability to re-create the regional climate over the period 1960 through 1990 and the agreement among models in future projections. Based on [14Yates D, Monaghan A, Steinhoff D. Regional atmospheric modeling for the arabian gulf region–future scenarios and capacity building final technical report for agedis local national and regional climate change programme 2015.], there is and increasing trend of precipitation that was shown by the collaborative of all the climate models, for the 21st century for the Arabian Gulf region. An upward trend starts around 1980. The per-day precipitation was about 0.38 mm in 1980, and expected to increase to about 0.43 mm by 2100.
The Representative Concentration Pathways (RCP) represent the latest generation of scenarios that are used as potential inputs into climate models that shows imposed greenhouse-gas concentration pathways during the 21st century, according to various radiative forcing stabilization levels by the year 2100 [18Bjørnæs C. A guide to representative concentration pathways CICERO 2013.-20Giorgi F, Jones C, Asrar GR, et al. Addressing climate information needs at the regional level: the cordex framework. World Meteorological Organization (WMO). Bulletin 2009; 58: 175.]. Adding that emissions scenarios are used to assess the contributions of human activities, such as population growth and economic developments, to future climate change.
Four emission scenarios have been used for climate research; namely RCP 2.6 (based on low emission), RCP 4.5 and RCP 6 (based on intermediate emissions) and RCP 8.5 (based on high emissions), with each assuming different radiative forcing and primary energy use levels [18Bjørnæs C. A guide to representative concentration pathways CICERO 2013.].
In order for any climate models to be realistic and applicable, at regional as well as global scales, some type of downscaling is necessary. Statistically based downscaling approaches (referred to as SDSM) of climate data have been around for more than a decade [21Wilby RL, Dawson CW. The statistical downscaling model: insights from one decade of application. Int J Climatol 2013; 33: 1707-19.
[http://dx.doi.org/10.1002/joc.3544] ]. Wilby and Dawson also outlined five steps, starting with the proper selection of predictor variables, for such modeling protocol to be reliable. One SDSM interface used in such protocols is MarksimGCMR [22Jones PG, Thornton PK, Heinke J. Generating characteristic daily weather data using downscaled climate model data from the IPCC’s Fourth Assessment 2009.]. It was initiated by the International Center for Tropical Agriculture (CIAT) and it is for IPCC AR5 data (CMIP5). MarkSimR, initially reported as a weather generator by [23Jones PG, Thornton PK. Marksim: software to generate daily weather data for latin america and africa. Agron J 2000; 92: 445-53.
[http://dx.doi.org/10.2134/agronj2000.923445x] ] is now a web-based SDSM tool (currently referred to as MarksimGCMR). It generates daily simulated weather data specifically designed for use in the tropics, including rainfall, maximum and minimum temperatures and solar radiation. MarkSimR is a weather generator that uses 720 classes of weather, worldwide, to calculate the coefficients of a third order Markov rainfall generator. Which involves 'stochastic downscaling' as it fits a Markov model to the GCM output and uses it to generate weather data for the site indicated. MarksimGCMR also provides options to select any combination of climate models and RCP scenarios for future years. The output can be a graphical display or downloadable raw data of solar radiation, maximum and minimum temperatures and rainfall predictions on a daily basis. In addition, MarkSim uses an internal structure called CLX for holding the derived parameters for a model run. This structure allows tracking the base climate data and the rotation of the record. The user has the option to create the CLX file in MarkSim GCM. The advantage will be facilitating the use of MarkSim directly in modelling systems.
As a consequence of the challenges presented by the global climate change, adaptations are urgently needed to minimize the risks on human health and ecosystem sustainability. The UAE has been initiating various measures of adaptations to climate change. One of the major outcomes of such initiatives, is development of the UAE National Climate Change Plan 2050 [24MOCCAE. UAE National Climate Change Plan 2050 2017.]. The plan aims to genuinely tackle climate change. But the process by which adaptations to climate change are to be assessed will involve institutional practices [25Adger WN, Arnell NW, Tompkins EL. Successful adaptation to climate change across scales. Glob Environ Change 2005; 15: 77-86.
[http://dx.doi.org/10.1016/j.gloenvcha.2004.12.005] ]. In order to succeed, any such attempts will require local data and predictions on the impact of climate change on ecosystem and human sustainable livelihood. In the present attempt, therefore, data from MarksimGCMR is used to assess different RCPs and their appropriateness as GCM inputs to predict temperatures and rainfall and study the effect of climate change on specific cities in the UAE as it relates to both temperature and rainfall abnormalities (Fig. 1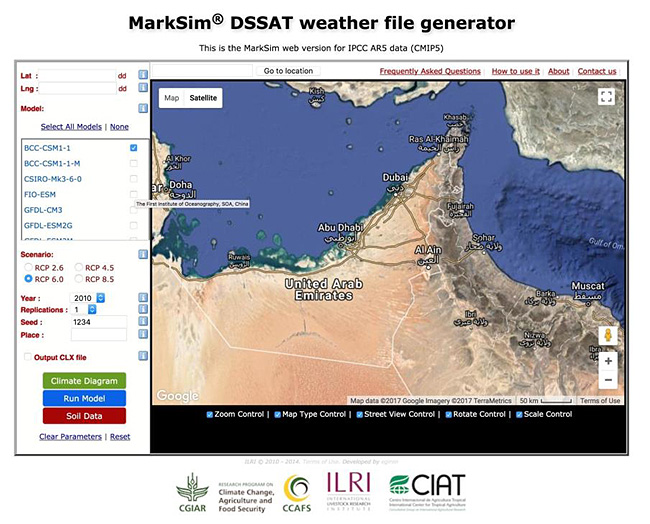 ).
).
 |
Fig. (1) A screen-shot of MarksimGCM web interface, showing the different selection options available for the end-users. |

2. MATERIALS AND METHODS
2.1. Study Area
The study was performed at three different regions within the UAE (with 8 different locations), covering a variety of climate regions. The list of locations sampled for their specific climate data are listed in Table 1.
2.2. Simulation Used
MarksimGCMR(http://gisweb.ciat.cgiar.org/MarkSimGCM/) was used to generate current year’s data as well as future predictions of climatic data. MarksimGCMR uses a combination of models (17 models), Representative Concentration Pathways or RCPs (RCP2.6, RCP4.5, RCP6 and RCP8.5), years (2010 to 2095) and replicates (1 to 99). For every location listed in Table 1, a climate data file was downloaded to the desktop for further analyses.
2.3. The Representative Concentration Pathways (RCP)
The RCPs are four greenhouse gas concentration trajectories adopted by the IPCC - Fifth Assessment Report (AR5): RCP 2.6, RCP 4.5, RCP 6.0 and RCP 8.5. The RCPs are named after the radiative forcing values by 2100 relative to pre-industrial values (+2.6, +4.5, +6.0, and +8.5 W/m2; respectively). Radiative forcing is a result to a perturbation in the concentration of a gas at the tropopause [26Ramaswamy V, Boucher O, Haigh J, et al. Radiative forcing of climate. Clim Change 2001; •••: 349.]. In the present work, we focused on using RCP 4.5 and 8.5 for our simulations of climate predictions in the UAE. One of the main features of this RCP 8.5 is that it is based on heavy use of fossil fuels, increasing use of croplands and declining use of grasslands [18Bjørnæs C. A guide to representative concentration pathways CICERO 2013.]. On the contrary, RCP 4.5 is regarded as a "Business As Usual" (BAU) alternative.
The list below describes all four scenarios as reported by [19Nakicenovic N, Alcamo J, Grubler A, et al. Special Report on Emissions Scenarios (SRES), A Special Report of Working Group III of the Intergovernmental Panel on Climate Change 2000.].
- RCP 2.6: It is a pathway representative of scenarios in the literature leading to very low greenhouse gas concentration levels. It is a so-called ”peak” scenario: represents a strong mitigation scenario and is extended by assuming constant emissions after 2100 (including net negative CO2 emissions), leading to CO2 concentrations returning to 360 ppm by 2300.
- RCP 4.5: It is a stabilization scenario where total radiative forcing is stabilized before 2100 by employment of a range of technologies and strategies for reducing greenhouse gas emissions.
- RCP 6.0: It is also a stabilization scenario where total radiative forcing is stabilized after 2100 without overshoot by employment of a range of technologies and strategies for reducing greenhouse gas emissions.
- RCP 8.5: It is characterized by increasing greenhouse gas emissions over time representative for scenarios in the literature leading to high greenhouse gas concentration levels. The underlying scenario drivers and resulting development path are based on the A2r scenario.
2.4. Data Amalgamation and Analyses
For each of the three UAE regions, data was downloaded for every RCP/Model/Year combination separately, replicated five times. Downloaded data included rainfall, maximum and minimum temperatures and solar radiation. Excel was then used to append all data into one file for further analyses. The following steps were followed for each location selected from the UAE map on MarksimGCMR (Fig. 2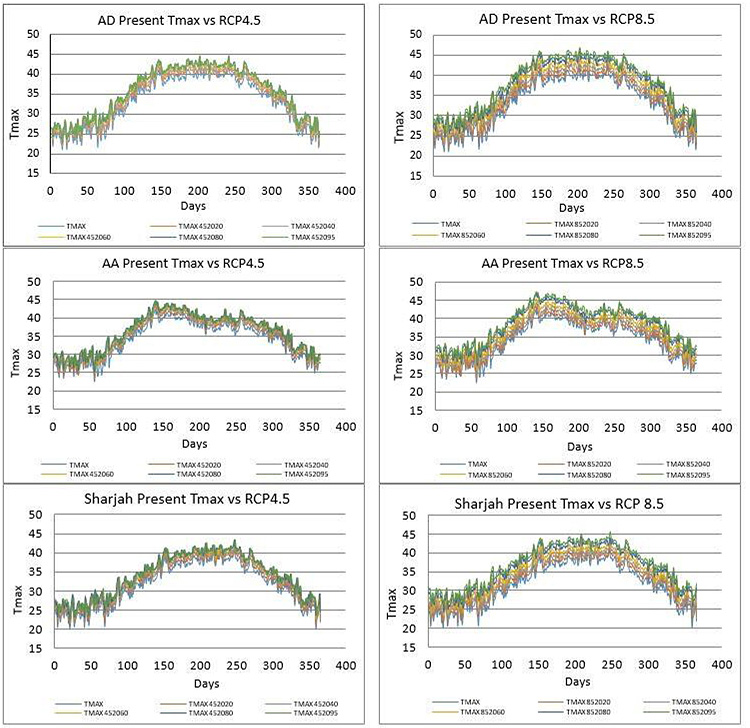 ):
):
- A combination of RCP/Model/Year was downloaded form MarksimGCMR .
- All downloaded files were combined in Excel.
- A correlation analysis was performed for each present climate data vs data of RCP4.5 and RCP8.5 for the years (2020, 2040, 2060, 2080, 2095) using all 17 GCMs averaged. In this regard, the website states that using all GCMs together "it averages the polynomial functions that drive the GCM differences so that it produces correctly downscaled weather data for the average GCM".
- All RCP predictions were assessed based on Pearson correlation coefficient,for both rainfall and temperature abnormalities.
- Graphs of correlation analyses were made to present the trends of thecurves and explain the correlations of the of the available data.
3. RESULTS
3.1. Future/Projected Changes in Temperature
The results of this study show a strong correlation between the present Tmax and Tmax 2020, Tmax 2040, Tmax 2060, Tmax 2080 and Tmax 2095 for both RCP4.5 and RCP8.5. In other words, maximum temperatures are going to increase in the coming years based on the predictions according to the different scenarios using MarksimGCMR . Fig. (3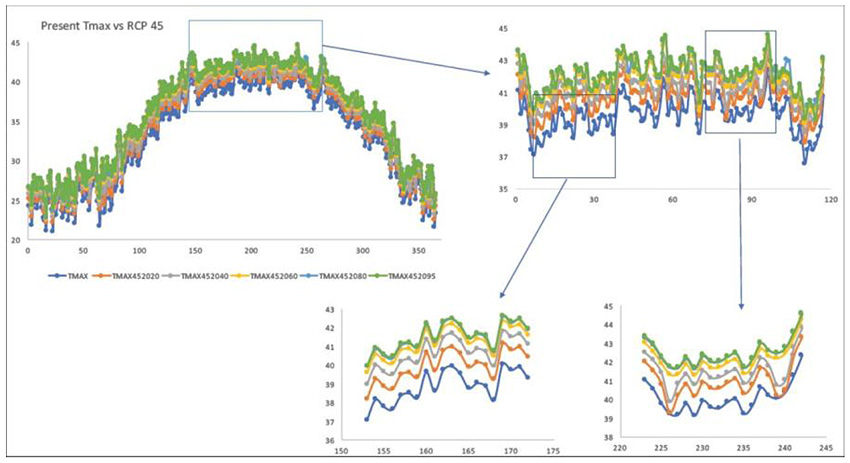 ) shows the maximum temperatures in summer season (May to September). This period was selected based on the trend of the curve. The rising temperatures followed the same trend for the different years (2020, 2040, 2060, 2080, 2095). The highest present Tmax is around 42.1°C while Tmax in 2095 based on RCP4.5 is projected to be around 44.6°C. The increase in the maximum temperatures will be about 2.44°C by 2095.
The correlation coefficient of Tmax for RCP4.5 and RCP8.5 in the years (2020, 2040, 2060, 2080, 2095) is presented in Table 2. The correlation coefficient ranges between 96.8% and 99.6%, which indicates a high correlation between the present and the projected maximum temperatures. The projected Tmax of 2020 RCP4.5, 2080 RCP4.5, 2020 RCP8.5 and 2060 RCP8.5 showed higher correlation coefficient. MarksimGCMR Predictions for these years are more accurate than the prediction of Tmax 2040 RCP4.5, 2060 RCP4.5, 2095 RCP4.5, 2040 RCP8.5, 2080 RCP8.5 and 2095 RCP8.5.
3.2. Future/Projected Changes in Rainfall
Rainfall showed no significance in the projected rates as shown in Fig. (4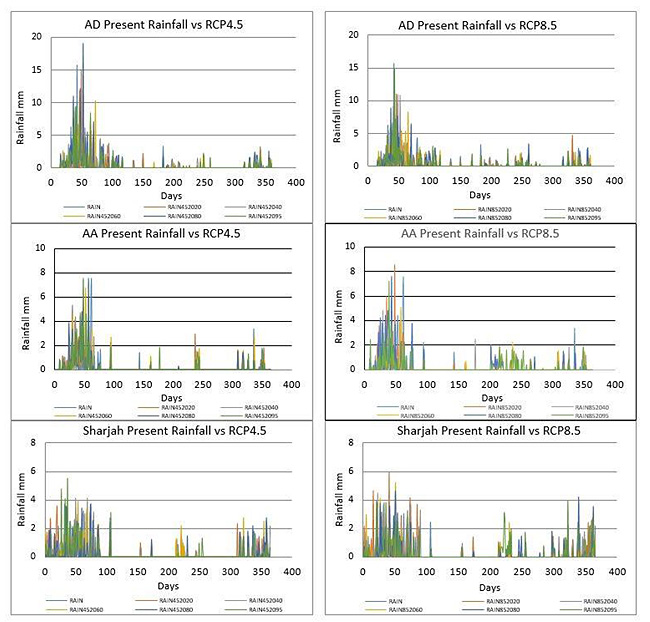 ), for all studied locations. In Abu Dhabi, rainfall rates are expected to be high in 2020 and 2080 by the end of February, using RCP4.5. While RCP8.5 scenario showed lower rates of rainfall except for 2095, which is expected to experience similar rainfalls to the present rates. Based on the results of RCP4.5 the maximum rainfall rate will occur by the end of February 2080, with an amount of 19.04 mm. RCP8.5 showed lower rainfall rate which will occur in the middle of February 2095, with amount of 14.84 mm, 0.92 mm than the present rate (15.76 mm). In other words, Abu Dhabi will experience the higher rainfall rates.
In Al-Ain, rainfall rates are expected to be high in March by 2080 and 2095 using RCP4.5. Similarly, it will experience high rainfall rates for RCP8.5, in March of 2080 and 2095 with over prediction in 2020, where the rainfall rate will be high in February, with some rainfall events in summer. In Al-Ain the highest rainfall rate for RCP4.5 will occur at the end of February with rate of 7.58 mm in year 2080. The next highest rate will occur in the middle of February 2095 with a rate of 7.44 mm. While for RCP8.5 the highest rate will occur in the middle of February 2020 with a rate of 8.56 mm. The next highest rate will occur in the middle of February 2080 with rainfall rate of 7.64 mm, which indicates that with RCP8.5 Al-Ain will experience more rains. With RCP8.5 Al-Ain will experience more rainfall events compared to RCP4.5 (Fig. 4).
In Sharjah, the rainfall rate based on RCP4.5 are the highest in 2095 with rate of (5.54, 4.8, 4.1). All events will occur by the end of January and the beginning of February. For RCP8.5, the highest rate occurs in the beginning of February 2020 with an amount of 5.96 mm, the next highest amount is by the end of February 2060 with a rate of 5.26 mm. Compared to Abu Dhabi and Al-Ain, Sharjah will experience lower rainfall rates, yet more frequent rainy events. Generally, the three cities will experience the highest rainfall events in January and February.
 |
Fig. (2) Correlations between present Tmax vs different Tmax RCP4.5 and RCP8.5 in Abu Dhabi (AD), Al-Ain (AA) and Sharjah. |
 |
Fig. (3) The maximum temperatures in summer season (27 May to 20 September in Abu Dhabi). |
 |
Fig. (4) Correlations between present present rain amount vs the predicted RCP rain amounts in Abu Dhabi, Al-Ain and Sharjah. |
4. DISCUSSION
MarksimGCMR is used for many research purposes, for example [27Patel C, Nema A, Singh R, et al. Assessment of climate change impact on wheat crop using marksim gcm in varanasi, uttar pradesh. J Agrometerol 2018; 20: 216-8.], used the generated data to assess the impact of climate change on phenology and yield of wheat crop. Their results showed that the impact was highest under RCP 8.5 in 2095. Another application is by [28Bekele F. 2015.Characterizing current and future rainfall variability and its effect on Wheat and Barley production in Sinana district, south eastern Ethiopia ] where the daily rainfall data for RCP4.5 emission scenario using Marksim GCM for the period 2020-2049 were used to study the trend of annual and seasonal total rainfall and assess the impact on yield. In our study we focus on temperature and rainfall rate changes through time and until the end of the century. Generally, the maximum temperature is increasing as was anticipated in higher concentrations of carbon dioxide, and the larger warming occurs in RCP8.5. According to MarksimGCMR predictions and the results of the current study, Al-Ain will experience the highest temperatures in 2095. The maximum temperature will reach 47.4°C, Abu Dhabi Temperature will reach 46.9°C and Sharjah 45.64°C. The increase in maximum temperatures in Abu Dhabi, Al-Ain and Sharjah is about (4.56, 4.74, 5.34°C) respectively. Sharjah will have the largest temperature increase by the end of the century. For RCP4.5, Al-Ain will have the largest increase (3.48°C), Abu Dhabi will have (2.44°C) and Sharjah will have (3.38°C) as shown in Table 3. The temperature rise will range between 2.44 and 4.56 for RCP4.5 and RCP8.5 in AbuDhabi, 3.84 and 4.74 in AlAin and 3.38 and 5.35 in Sharjah.
The Arabian Gulf Region trends for the period 1950-2100 using RCP8.5, showed a temperature increase during the 21st century and with steeper trends after 2060 [29Agedi. Regional Atmospheric Modeling- Future Scenarios - Climate Change. Technical Report. EAD. 2015.]. Average future temperature increases are expected to be 2°C to 3°C higher over land areas and 1.5°C to 2°C, over Gulf waters across the region [16Agedi, 2017. AGEDI 2017. Sea level Rise Primer. Technical Report. EAD. Allen, M.R., Stott, P.A., Mitchell, J.F., Schnur, R., Delworth, T.L., 2000. Quantifying the uncertainty in forecasts of anthropogenic climate change. Nature 407: 617.]. The GCMs indicate a significant increase in daily temperatures which indicate a rise in the risk of severe heat waves [30Field CB, Barros V, Stocker TF, Dahe Q. Managing the risks of extreme events and disasters to advance climate change adaptation: special report of the intergovernmental panel on climate change 2012.
[http://dx.doi.org/10.1017/CBO9781139177245] , 31Chou SC, Lyra A, Mour˜ao C, et al. Assessment of climate change over south America under rcp 4.5 and 8.5 downscaling scenarios. Am J Clim Change 2014; 3: 512-25.
[http://dx.doi.org/10.4236/ajcc.2014.35043] ] found that as expected in higher equivalent CO2 concentrations, larger warming occurs in RCP8.5. The results showed that the largest changes in temperature occur between the present and the first period, (2011 to 2040) in RCP4.5, whereas in the RCP8.5 the highest degrees of temperatures occurs between (2041 to 2070) and (2071 to 2100) [32] compared the mid-century period (2046 to 2065) and the end-century period (2081 to 2100) with the recent period (1986 to 2005). Based to RCP8.5 scenario. They found that by the end of the century, many countries in the Middle East and Northern Africa in summer season are projected to experience a temperature increase more than 6°C compared to (1986 to 2005) [33Jacob D, Petersen J, Eggert B, et al. Euro-cordex: new high-resolution climate change projections for european impact research. Reg Environ Change 2014; 14: 563-78.
[http://dx.doi.org/10.1007/s10113-013-0499-2] ]. The results showed a strong and statistically significant warming, with regional differences, in the range of 1 to 4.5°C for RCP4.5 and of 2.5°C to 5.5°C for RCP8.5. Compared to 1971-2000, which is not applicable for RCP4.5, large parts of Northern Scandinavia, Eastern Europe and the Alpine ridge might be exposed to a warming of more than 4.5°C under RCP8.5. For UAE [29Agedi. Regional Atmospheric Modeling- Future Scenarios - Climate Change. Technical Report. EAD. 2015.], reported that, simulations of 2060 to 2079 showed that temperatures are projected to statistically significantly increase in all months and for both the RCP4.5 and RCP8.5 scenarios. There will be an increase of 2°C for RCP4.5 and 3°C for RCP8.5. Based on this study results, the warming is in the range of 2.44°C to 3.38°C for RCP4.5 and of 4.56°C to 5.35°C for RCP8.5 [34] showed that the collective average of GCMs increased until reaching a maximum value of 3.9°C in Tmax and 2.9°C in Tmin under RCP8.5 in the 2080s. The same results reported by Chong-Hai and [35Chong-Hai X, Ying X. The projection of temperature and precipitation over china under rcp scenarios using a cmip5 multi-model ensemble. Atmos Ocean Sci Lett 2012; 5: 527-33.
[http://dx.doi.org/10.1080/16742834.2012.11447042] ] showed that the expected time series of annual temperature has deviation trends similar to the emission pathway. They found that for RCP4.5, the temperature is increasing until 2070 and stabilizing from 2070 to 2100. On the other hand, for RCP8.5, the temperature will rise with the constant increase of radiative forcing. Based on [15Kiwan MK, Kabshawi MM, Qarqaz MM, et al. Climate change impacts, vulnerability adaptation 2009.] the projections of temperature are mainly consistent for the next 20 years, with a 1°C increase, but show larger uncertainty in the 40-year projections. By 2100, the temperatures are expected to rise between 3.1 to 4.8°C. For RCP4.5, the warming in 2041 to 2070 is nearly 2.0°C, (0.5°C) less than at the end of the 21st century (approximately 2.5°C) [35Chong-Hai X, Ying X. The projection of temperature and precipitation over china under rcp scenarios using a cmip5 multi-model ensemble. Atmos Ocean Sci Lett 2012; 5: 527-33.
[http://dx.doi.org/10.1080/16742834.2012.11447042] ]. While for RCP8.5, the warming at the end of the 21st century (approximately 5.1°C) is extraordinarily greater than in 2041 to 2070 (approximately 3.0°C). Currently, maximum daytime temperature during the hottest days is about 43°C, it is expected to reach 47°C by the middle of the century, and nearly 50°C by the end of the century in the RCP8.5 scenario (Fig.5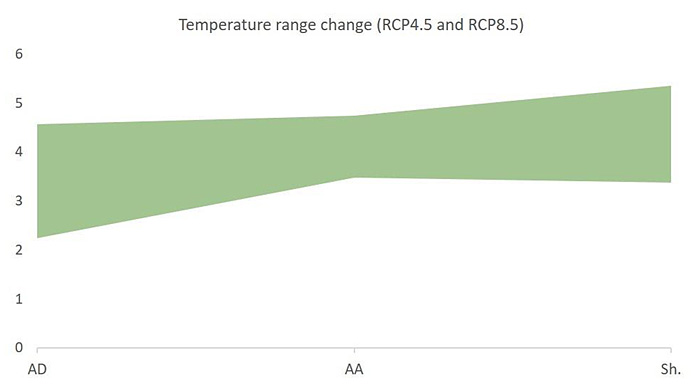 ) [32Lelieveld J, Proestos Y, Hadjinicolaou P, Tanarhte M, Tyrlis E, Zittis G. Strongly increasing heat extremes in the middle east and north africa (mena) in the 21st century. Clim Change 2016; 137: 245-60.
[http://dx.doi.org/10.1007/s10584-016-1665-6] ].
For the rainfall rate, it was found that the rate will range between (-0.92) and 3.32 for RCP4.5 and RCP8.5 in Abu Dhabi, 0.14 and 1.12 in AlAin and 1.9 and 2.23 in Sharjah. The UAE has experienced about 60% of time drought in 45 years [36Sherif M, Almulla M, Shetty A, Chowdhury RK. Analysis of rainfall, pmp and drought in the united arab emirates. Int J Climatol 2014; 34: 1318-28.
[http://dx.doi.org/10.1002/joc.3768] ]. Regional changes are more uncertain and could vary from region to region, with some location experiencing more and others less precipitation. Projections showed wide range of rates varying between -21% to +10% by 2050 and -38% to +18% by 2100 [15Kiwan MK, Kabshawi MM, Qarqaz MM, et al. Climate change impacts, vulnerability adaptation 2009.]. Similar to our findings, precipitation projections show even greater variation than temperature (Table 4). Some models project a dryer region with decreasing precipitation, while others project a wetter region with a significant increase in precipitation [3Dougherty B, Fencl A, Swartz C, Fisher J, Osman B, Yates D. Climate Change Impacts 2009.]. further investigations using SDSM, could pinpoint the trend as well as the magnitude of change (Fig.6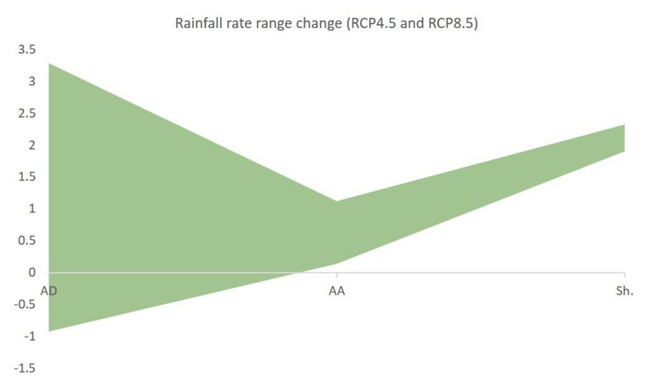 ).
).
 |
Fig. (5) Change range of temperature in Abu Dhabi (AD), Al-Ain (AA) and Sharjah (Sh) for RCP4.5 and RCP8.5. |
 |
Fig. (6) Change range of rainfall in Abu Dhabi, Al-Ain and Sharjah for RCP4.5 and RCP8.5. |
CONCLUSION
The urgency of climate adaptations and mitigations requires the use of GCM models to predict the impact of climate change [7Merryfield WJ, Lee WS, Boer GJ, et al. The canadian seasonal to interannual prediction system. part i: Models and initialization. Mon Weather Rev 2013; 141: 2910-45.
[http://dx.doi.org/10.1175/MWR-D-12-00216.1] ]. The results of this study show a strong correlation to Temperature and no correlation to rainfall. The temperature will significantly increase in the coming 70 years, reaching the highest rates by the end of the century. According to RCP8.5, the maximum temperatures will increase by 4.56°C in Abu Dhabi, 4.74°C in Al-Ain and 5.37°C in Sharjah, by 2095. In Abu Dhabi the maximum rainfall rate will occur in 2080 with amount of 19.04%. In Al-Ain it will be 7.85% in 2080, and 5.96% for Sharjah in 2060. Abu Dhabi will be having the lowest increase in temperatures and highest rates of rain. The difference in temperatures is not very high compared to the other two cities (0.18°C lower than Al-Ain and 0.81°C lower than Sharjah). Rainfall rates will also vary, but not significantly as discussed above. Compared to Abu Dhabi and Al-Ain, Sharjah will experience lower rainfall rates, yet more frequent rainfall events which can lead to more drought events, erratic weather conditions and climatic changes. Still to be assessed is the specifics of each major GCM and their powers to predict UAE climate. This can be the next step in our endeavor.
CONSENT FOR PUBLICATION
Not applicable.
AVAILABILITY OF DATA AND MATERIALS
The data that support the findings of this study are available from the corresponding author [T.K.], upon reasonable request.
FUNDING
None.
CONFLICT OF INTEREST
The authors declare no conflict of interest, financial or otherwise.
ACKNOWLEDGEMENTS
The authors would like to than the Biology Department at the UAE University; the Department of Meteorology and Institute of Mining and Mineral processing, South Eastern Kenya University, Kitui, Kenya.
REFERENCES
| [1] | Stocker T. Climate change 2013: the physical science basis: Working Group I contribution to the Fifth assessment report of the Intergovernmental Panel on Climate Change 2014. |
| [2] | Yearbook UAE. Ministry of information and culture 2010. |
| [3] | Dougherty B, Fencl A, Swartz C, Fisher J, Osman B, Yates D. Climate Change Impacts 2009. |
| [4] | Chen H, Xu CY, Guo S. Comparison and evaluation of multiple gcms, statistical downscaling and hydrological models in the study of climate change impacts on runoff. J Hydrol (Amst) 2012; 434: 36-45. [http://dx.doi.org/10.1016/j.jhydrol.2012.02.040] |
| [5] | Evans JP. 21st century climate change in the middle east. Clim Change 2009; 92: 417-32. [http://dx.doi.org/10.1007/s10584-008-9438-5] |
| [6] | Cramer W, Bondeau A, Woodward FI, et al. Global response of terrestrial ecosystem structure and function to co2 and climate change: results from six dynamic global vegetation models. Glob Change Biol 2001; 7: 357-73. [http://dx.doi.org/10.1046/j.1365-2486.2001.00383.x] |
| [7] | Merryfield WJ, Lee WS, Boer GJ, et al. The canadian seasonal to interannual prediction system. part i: Models and initialization. Mon Weather Rev 2013; 141: 2910-45. [http://dx.doi.org/10.1175/MWR-D-12-00216.1] |
| [8] | Randall DA, Wood RA, Bony S, et al. Climate models and their evaluation.Climate change 2007: The physical science basis Contribution of Working Group I to the Fourth Assessment Report of the IPCC (FAR) 2007; 589-662. |
| [9] | Lin JL, Kiladis GN, Mapes BE, et al. Tropical intraseasonal variability in 14 ipcc ar4 climate models. Part i: Convective signals. J Clim 2006; 19: 2665-90. [http://dx.doi.org/10.1175/JCLI3735.1] |
| [10] | Feulner GR. Rainfall and climate records from sharjah airport: Historical data for the study of recent climatic periodicity in the uae. Tribulus (Abu Dhabi) 2006; 16: 3-9. |
| [11] | Almazroui M, Nazrul Islam M, Athar H, Jones P, Rahman MA. Recent climate change in the arabian peninsula: annual rainfall and temperature analysis of saudi arabia for 1978–2009. Int J Climatol 2012; 32: 953-66. [http://dx.doi.org/10.1002/joc.3446] |
| [12] | G.J.. Regional climate modelling. Meteorology and Atmospheric Physics 1997; 63: 105-17. |
| [13] | Giorgi F, Coppola E, Solmon F, et al. Regcm4: model description and preliminary tests over multiple cordex domains. Clim Res 2012; 52: 7-29. [http://dx.doi.org/10.3354/cr01018] |
| [14] | Yates D, Monaghan A, Steinhoff D. Regional atmospheric modeling for the arabian gulf region–future scenarios and capacity building final technical report for agedis local national and regional climate change programme 2015. |
| [15] | Kiwan MK, Kabshawi MM, Qarqaz MM, et al. Climate change impacts, vulnerability adaptation 2009. |
| [16] | Agedi, 2017. AGEDI 2017. Sea level Rise Primer. Technical Report. EAD. Allen, M.R., Stott, P.A., Mitchell, J.F., Schnur, R., Delworth, T.L., 2000. Quantifying the uncertainty in forecasts of anthropogenic climate change. Nature 407: 617. |
| [17] | Tebaldi C, Smith RL, Nychka D, Mearns LO. Quantifying uncertainty in projections of regional climate change: A bayesian approach to the analysis of multimodel ensembles. J Clim 2005; 18: 1524-40. [http://dx.doi.org/10.1175/JCLI3363.1] |
| [18] | Bjørnæs C. A guide to representative concentration pathways CICERO 2013. |
| [19] | Nakicenovic N, Alcamo J, Grubler A, et al. Special Report on Emissions Scenarios (SRES), A Special Report of Working Group III of the Intergovernmental Panel on Climate Change 2000. |
| [20] | Giorgi F, Jones C, Asrar GR, et al. Addressing climate information needs at the regional level: the cordex framework. World Meteorological Organization (WMO). Bulletin 2009; 58: 175. |
| [21] | Wilby RL, Dawson CW. The statistical downscaling model: insights from one decade of application. Int J Climatol 2013; 33: 1707-19. [http://dx.doi.org/10.1002/joc.3544] |
| [22] | Jones PG, Thornton PK, Heinke J. Generating characteristic daily weather data using downscaled climate model data from the IPCC’s Fourth Assessment 2009. |
| [23] | Jones PG, Thornton PK. Marksim: software to generate daily weather data for latin america and africa. Agron J 2000; 92: 445-53. [http://dx.doi.org/10.2134/agronj2000.923445x] |
| [24] | MOCCAE. UAE National Climate Change Plan 2050 2017. |
| [25] | Adger WN, Arnell NW, Tompkins EL. Successful adaptation to climate change across scales. Glob Environ Change 2005; 15: 77-86. [http://dx.doi.org/10.1016/j.gloenvcha.2004.12.005] |
| [26] | Ramaswamy V, Boucher O, Haigh J, et al. Radiative forcing of climate. Clim Change 2001; •••: 349. |
| [27] | Patel C, Nema A, Singh R, et al. Assessment of climate change impact on wheat crop using marksim gcm in varanasi, uttar pradesh. J Agrometerol 2018; 20: 216-8. |
| [28] | Bekele F. 2015.Characterizing current and future rainfall variability and its effect on Wheat and Barley production in Sinana district, south eastern Ethiopia |
| [29] | Agedi. Regional Atmospheric Modeling- Future Scenarios - Climate Change. Technical Report. EAD. 2015. |
| [30] | Field CB, Barros V, Stocker TF, Dahe Q. Managing the risks of extreme events and disasters to advance climate change adaptation: special report of the intergovernmental panel on climate change 2012. [http://dx.doi.org/10.1017/CBO9781139177245] |
| [31] | Chou SC, Lyra A, Mour˜ao C, et al. Assessment of climate change over south America under rcp 4.5 and 8.5 downscaling scenarios. Am J Clim Change 2014; 3: 512-25. [http://dx.doi.org/10.4236/ajcc.2014.35043] |
| [32] | Lelieveld J, Proestos Y, Hadjinicolaou P, Tanarhte M, Tyrlis E, Zittis G. Strongly increasing heat extremes in the middle east and north africa (mena) in the 21st century. Clim Change 2016; 137: 245-60. [http://dx.doi.org/10.1007/s10584-016-1665-6] |
| [33] | Jacob D, Petersen J, Eggert B, et al. Euro-cordex: new high-resolution climate change projections for european impact research. Reg Environ Change 2014; 14: 563-78. [http://dx.doi.org/10.1007/s10113-013-0499-2] |
| [34] | Zhang Y, You Q, Chen C, Ge J. Impacts of climate change on streamflows under rcp scenarios: A case study in xin river basin, china. Atmos Res 2016; 178: 521-34. [http://dx.doi.org/10.1016/j.atmosres.2016.04.018] |
| [35] | Chong-Hai X, Ying X. The projection of temperature and precipitation over china under rcp scenarios using a cmip5 multi-model ensemble. Atmos Ocean Sci Lett 2012; 5: 527-33. [http://dx.doi.org/10.1080/16742834.2012.11447042] |
| [36] | Sherif M, Almulla M, Shetty A, Chowdhury RK. Analysis of rainfall, pmp and drought in the united arab emirates. Int J Climatol 2014; 34: 1318-28. [http://dx.doi.org/10.1002/joc.3768] |