- Home
- About Journals
-
Information for Authors/ReviewersEditorial Policies
Publication Fee
Publication Cycle - Process Flowchart
Online Manuscript Submission and Tracking System
Publishing Ethics and Rectitude
Authorship
Author Benefits
Reviewer Guidelines
Guest Editor Guidelines
Peer Review Workflow
Quick Track Option
Copyediting Services
Bentham Open Membership
Bentham Open Advisory Board
Archiving Policies
Fabricating and Stating False Information
Post Publication Discussions and Corrections
Editorial Management
Advertise With Us
Funding Agencies
Rate List
Kudos
General FAQs
Special Fee Waivers and Discounts
- Contact
- Help
- About Us
- Search


The Open Atmospheric Science Journal
(Discontinued)
ISSN: 1874-2823 ― Volume 14, 2020
Spatial-temporal Variability of Seasonal Precipitation in Iran
Majid Javari*
Abstract
Spatial-seasonal variability and temporal trends has essential importance to climatic prediction and analysis. The aim of this research is the seasonal variations and temporal trends in the Iran were predicted by using rainfall series. The exploratory-confirmatory method, and seasonal time series procedure (STSP), temporal trend (TT), seasonal least squares (SLS) and spatial (GIS) methods (STSP¬-SLS-GIS) were employed to bring to light rainfall spatial-seasonal variability and temporal trends (SSVTT). To explore the spatial-seasonal variability and temporal trends during the period over 1975 to 2014 at 140 stations. To investigate the spatial-seasonal variability and temporal trends amount of each series was studied using ArcGIS 10.3 on different time scale. New climatic findings for the region: the investigates and predictions revealed that: (a) range of monthly and seasonal changes of rainfall tends to be highest (increasing trend) during winter (Winter Seasonal Index or WUSI=137.83 mm); (b) lowest (decreasing trend) during summer (Summer Seasonal Index or SUSI=20.8l mm) and (c) the coefficient of rainfall seasonal pattern variations in winter to 5.94 mm, in spring to 11.13 mm, in summer to 4.44 mm and in autumn to 8.05 mm with seasonality being the most effective of all. Mean annual rainfall changed from 51.45 mm (at Bafgh) to 1834.9 mm (at Bandar Anzali). Maximum decrease in annual rainfall was obtained at Miandeh Jiroft (-143.83%) and minimum at Abali (-0.013%) station. The most apparent year of variation was 2007 in annual rainfall.
Article Information

Identifiers and Pagination:
Year: 2016Volume: 10
First Page: 84
Last Page: 102
Publisher Id: TOASCJ-10-84
DOI: 10.2174/1874282301610010084
Article History:
Received Date: 06/06/2016Revision Received Date: 05/08/2016
Acceptance Date: 17/08/2016
Electronic publication date: 26/12/2016
Collection year: 2016
open-access license: This is an open access article licensed under the terms of the Creative Commons Attribution-Non-Commercial 4.0 International Public License (CC BY-NC 4.0) (https://creativecommons.org/licenses/by-nc/4.0/legalcode), which permits unrestricted, non-commercial use, distribution and reproduction in any medium, provided the work is properly cited.
* Address correspondence to this author at the Climatology, College of Social Science, Payame Noor University, P.O. BOX 19395-3697, Tehran, Iran; Tel: 09133285930; E-mail: majid_javari@yahoo.com
| Open Peer Review Details | |||
|---|---|---|---|
| Manuscript submitted on 06-06-2016 |
Original Manuscript | Spatial-temporal Variability of Seasonal Precipitation in Iran | |
1. INTRODUCTION
The variability of climatic elements are useful for identifying changes in variability patterns of the environment over time. Rainfall variability modeling is an important research area which has attracted the interest of climatologists [1de Luis M, Čufar K, Saz M, Longares L, Ceglar A, Kajfež-Bogataj L. Trends in seasonal precipitation and temperature in Slovenia during 1951-2007. Reg Environ Change 2014; 14: 1801-10.
[http://dx.doi.org/10.1007/s10113-012-0365-7] ]. Climatologists, over the last few decades, have taken advantage of the spatial-seasonal variability and temporal trends as an important research method [2Liu H, Tian H-q, Pan D-f, Li Y-f. Forecasting models for wind speed using wavelet, wavelet packet, time series and Artificial Neural Networks. Appl Energy 2013; 107: 191-208.
[http://dx.doi.org/10.1016/j.apenergy.2013.02.002] ]. Thus, considering rainfall spatial-seasonal variability, temporal trends’ variability, and extreme consequences related to climate variability is crucial with respect to the capacity of environmental conditions to change natural resources. Locally, in the recent periods, rainfall spatial-seasonal variability, temporal trends’ variability, and extreme consequences have caused massive damages to the environment [3Sayemuzzaman M, Jha MK. Seasonal and annual precipitation time series trend analysis in North Carolina, United States. Atmos Res 2014; 137: 183-94.
[http://dx.doi.org/10.1016/j.atmosres.2013.10.012] ]. Therefore, many researchers have placed special emphasis on rainfall spatial-seasonal variability, temporal trends variability, and their impact on the environment [4Yao Z, Liu Z, Huang H, Liu G, Wu S. Statistical estimation of the impacts of glaciers and climate change on river runoff in the headwaters of the Yangtze River. Quat Int 2014; 336: 89-97.
[http://dx.doi.org/10.1016/j.quaint.2013.04.026] ]. Numerous analyses have examined spatial-seasonal variability and temporal trends’ variability at various temporal periods in many parts of the world [3Sayemuzzaman M, Jha MK. Seasonal and annual precipitation time series trend analysis in North Carolina, United States. Atmos Res 2014; 137: 183-94.
[http://dx.doi.org/10.1016/j.atmosres.2013.10.012] , 5Khashei M, Rafiei FM, Mirahmadi A. Seasonal interval time series models in comparative study of industrial forecasting. Int J Curr Trends
Eng Technol 2015; I(II).-8Valencia J, Olivar G, Franco CJ, Dyner I. Qualitative Analysis of Climate Seasonality Effects in a Model of National Electricity Market. In: Vasilieva O, Ed. Analysis, Modelling, Optimization, and Numerical Techniques. Tost, GO: Springer International Publishing 2015; pp. 349-62.
[http://dx.doi.org/10.1007/978-3-319-12583-1_24] ]. The seasonal variability with shorter intervals often displays a regular pattern of fluctuations, reported from year to year. SSVTT is a methodology for assessing and predicting a quantitative model for non-linear and linear relations between climatic variables and analyzed patterns of spatial and seasonal variations among a set of observed variables, particularly precipitation [9Delavau C, Chun KP, Stadnyk T, Birks SJ, Welker JM. North American precipitation isotope (δ18O) zones revealed in time series modeling across Canada and northern United States. Water Resour Res 2015; 51: 1284-99.
[http://dx.doi.org/10.1002/2014WR015687] , 10Mahoney K, Ralph FM, Wolter K, et al. Climatology of extreme daily precipitation in Colorado and its diverse spatial and seasonal variability. J Hydrometeorol 2014; 16: 781-92.
[http://dx.doi.org/10.1175/JHM-D-14-0112.1] ]. SSVTT also allows the expansion of spatial and seasonal variations by estimating the terms of error and accuracy indices for precipitation [11Gundogdu I. Usage of multivariate geostatistics in interpolation processes for meteorological precipitation maps. Theor Appl Climatol 2015; 1-6.
[http://dx.doi.org/10.1007/s00704-015-1619-3] , 12Ghoraba SM. Hydrological modeling of the Simly Dam watershed (Pakistan) using GIS and SWAT model. Alexandria Eng J 54(3): 583-94.
[http://dx.doi.org////dx.doi.org/10.1016/j.aej.2015.05.018] ]. The spatial and seasonal variability analysis approach has recently focused not only on investigating the climatic variations [13Pereira P, Oliva M, Misiune I. Spatial interpolation of precipitation indexes in Sierra Nevada (Spain): comparing the performance of some interpolation methods. Theor Appl Climatol 2016; 126(3): 683-98.], but also demonstrating variations in series of rainfall and other climatic elements [14Goyal MK, Singh V, Meena AH. Geospatial and hydrological modeling to assess hydropower potential zones and site location over rainfall dependent Inland catchment. Water Res Mana 2015; 29: 2875-94.
[http://dx.doi.org/10.1007/s11269-015-0975-1] , 15Ifeka A, Akinbobola A. Trend analysis of precipitation in some selected stations in anambra state. Atmos Clim Sci 2015; 5: 1.
[http://dx.doi.org/10.4236/acs.2015.51001] ]. SSVTT is designed to be affected by two factors, which can be removed from the observed series [16Javari M. A study of impacts of temperature components on precipitation in Iran using SEM-PLS-GIS. J Earth Sci Clim Change 2015.
[http://dx.doi.org/10.4172/2157-7617.S3-004] , 17Pascale S, Lucarini V, Feng X, Porporato A, Hasson Su. Analysis of rainfall seasonality from observations and climate models. Clim Dyn 2015; 44: 3281-301.
[http://dx.doi.org/10.1007/s00382-014-2278-2] ]; these factors are multiplicative and additive models [18Tabari H, Somee BS, Zadeh MR. Testing for long-term trends in climatic variables in Iran. Atmos Res 2011; 100: 132-40.
[http://dx.doi.org/10.1016/j.atmosres.2011.01.005] -20Singh D, Glupta RD, Jain SK. Statistical analysis of long term spatial and temporal trends of temperature parameters over Sutlej river basin, India. J Earth Syst Sci 2015; 124: 17-35.
[http://dx.doi.org/10.1007/s12040-014-0530-0] ]. Based on multiplicative and additive models with trended and non-trend structure, SSVTT technique has a discrete part on negative and positive continuous parts. SSVTT in a quantitative-spatial technique oscillates within a year [21Brockwell PJ, Davis RA. Time series: theory and methods. Germany: Springer Science & Business Media 2013., 22Javari M. Spatial neighborhood analysis of the monthly rainfall in Iran. Geoinform Geostat 2015; 3: 15.]. The essential techniques producing seasonal variability are temporal patterns’ variability, climatic factors’ effectiveness, etc [23Some'e BS, Ezani A, Tabari H. Spatiotemporal trends and change point of precipitation in Iran. Atmos Res 2012; 113: 1-12.
[http://dx.doi.org/10.1016/j.atmosres.2012.04.016] ]. In this study, the relation between the monthly, seasonal, and annual precipitation variations of spatial-temporal patterns and trend patterns in Iran rainfall is analyzed [18Tabari H, Somee BS, Zadeh MR. Testing for long-term trends in climatic variables in Iran. Atmos Res 2011; 100: 132-40.
[http://dx.doi.org/10.1016/j.atmosres.2011.01.005] ]. The seasonal trended and non-trended patterns of rainfall were studied [24Becketti S. Introduction to time series using Stata. USA: Stata Press 2013.-26Javari M. Quantitative Methods in Climatology (Trend Models). Iran: Payam Resan Press 2010; pp. 30-70.]. Similarly, the current study analyzed four spatial-seasonal patterns as representing overall rainfall. The following patterns were investigated: (1) determining spatial-seasonal variability in rainfall at seasonal periods, (2) discovering temporal trends’ variability, and (3) examining the temporal patterns of rainfall over the study area.
2. MATERIALS AND STUDY AREA
Iran is a multiple climatic country located at the border between the Caspian Sea, Oman Sea, and Persian Gulf, extending from 25° 3' to 39° 47” N and from 44° 5' to 63° 18' E. In this study, spatial-seasonal and trend variations have been predicted at 140 rainfall stations in Iran to identify the time series patterns. With regard to rainfall patterns changes in Iran, monthly and seasonal precipitations were chosen, obtained from Iran Meteorological Organization (http://www.irimo.ir), containing the monthly, seasonal, and annual series of 140 stations in Iran in the period of 1975-2014 (Fig. 1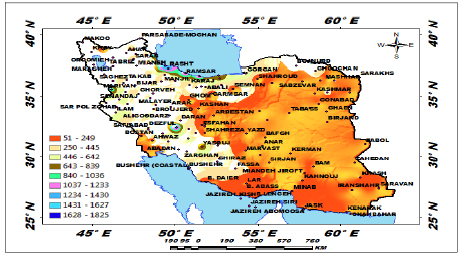 ). All the rainfalls series required quality analysis. To evaluate the homogeneity of the rainfall series, the Von Neumann homogeneity test was used at 5% significance level [18Tabari H, Somee BS, Zadeh MR. Testing for long-term trends in climatic variables in Iran. Atmos Res 2011; 100: 132-40.
[http://dx.doi.org/10.1016/j.atmosres.2011.01.005] , 27Shirvani A. Change point analysis of mean annual air temperature in Iran. Atmos Res 2015; 160: 91-8.
[http://dx.doi.org/10.1016/j.atmosres.2015.03.007] ].
 |
Fig. (1) Location of stations. |
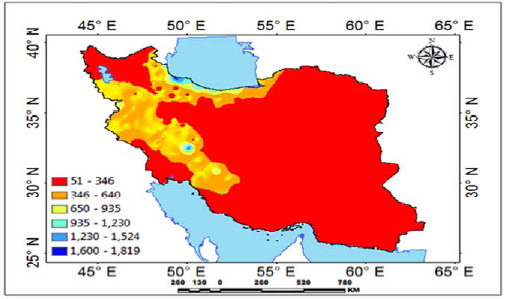 |
Fig. (2) The annual distribution in Iran. |
The analysis of the Von Neumann test results showed that stations with test values higher than two were considered homogeneous for 40 years. The results of the Von Neumann test are shown in Table 1, revealing that all the series are homogenous.
The current study focused on monthly and seasonal variations. Annual rainfall fluctuates from 51.45 to 1834.9 mm. High rainfall, 1600-1819 mm, was observed in the south-west part of Khazar Sea. Comparatively, lower rainfall, 51-346 mm, was observed in the south and central parts of Iran. The lowest rainfall rate, below 51 mm, was observed in south-east areas (Fig. 2 ).
).
Analyses of rainfall variations’ coefficient (ratio of spatial standard deviation to the mean) revealed the highest value, approximately 39.4%, in northern (Caspian Sea) and central areas, and the lowest rainfall variations’ coefficient, below 1%, in the west and north-west areas (Fig. 3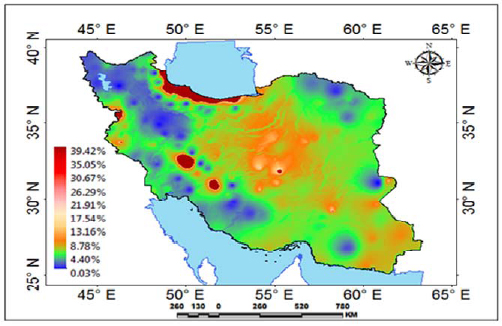 ).
).
 |
Fig. (3) The variations coefficient of rainfall in Iran. |
3. METHODS
SSVTT model is the most common method used to analyze rainfall [26Javari M. Quantitative Methods in Climatology (Trend Models). Iran: Payam Resan Press 2010; pp. 30-70.]. SSVTT was developed by climatologists who provided the distribution rates of rainfall spatial-seasonal variability and temporal trends’ variability [28Muhire I, Ahmed F. Spatio-temporal trend analysis of precipitation data over Rwanda. S Afr Geogr J 2015; 97: 50-68.
[http://dx.doi.org/10.1080/03736245.2014.924869] ]. Climatic variables tend to demonstrate variability patterns through natural components. The application of nonparametric and parametric tests tends to be a more vigorous decision when assessing rainfall, considering spatial-seasonal variability, and temporal trends’ variability. One of the important difficulties in assessing trends is the influence of normality and non-normality on climatic variables. To analyze the spatial-seasonal variability and temporal trends of rainfall variation, the following arrangements were applied: (1) the initial measurement of seasonal and trend parameters (measurement, analysis, prediction, and control) of seasonal and annual rainfall series was done for each series over the period of 1975 to 2014; (2) time series models were examined for parametric and non-parametric tests [19Shumway RH, Stoffer DS. Time series analysis and its applications. Springer Science & Business Media 2013., 29Shi P, Wu M, Qu S, et al. Spatial distribution and temporal trends in precipitation concentration indices for the southwest China. Water Resour Manage 2015; 29: 3941-55.
[http://dx.doi.org/10.1007/s11269-015-1038-3] ]; (3) series were examined for seasonality and trend variations in the rainfall series over time using time series models; (4) regionalization was done by Mann-Kendall test and Sen Slope estimator test [30Roy SS, Rouault M. Spatial patterns of seasonal scale trends in extreme hourly precipitation in South Africa. Appl Geogr 2013; 39: 151-7.
[http://dx.doi.org/10.1016/j.apgeog.2012.11.022] , 31Yue S, Pilon P, Cavadias G. Power of the Mann-Kendall and Spearman's rho tests for detecting monotonic trends in hydrological series. J Hydrol (Amst) 2002; 259: 254-71.
[http://dx.doi.org/10.1016/S0022-1694(01)00594-7] ], and seasonality tests were used for rainfall series to discover the direction and amount of a trend [32Hirsch RM, Slack JR. A nonparametric trend test for seasonal data with serial dependence. Water Resour Res 1984; 20: 727-32.
[http://dx.doi.org/10.1029/WR020i006p00727] ] and to distinguish the seasonal patterns and change; coefficient statistics was used for variations to find out rainfall changes’ gradient; (5) the confidence interval at 95% was used on the annual series classified by slope estimator intervals [33Mann HB. Nonparametric tests against trend. Econometrica 1945; 13: 245-59.
[http://dx.doi.org/10.2307/1907187] ]; (6) the amount of seasonal variations was calculated by least squares for the entire series, and spatial patterns analysis was applied for ArcGIS 10.3. In this regard, to analyze the spatial-seasonal variability and temporal trends’ rainfall variation, time series method were used. To assess the short-term variability of seasonal time series, Kruskal-Wallis [34Kanji GK. 100 STATISTICAL TESTS. 3rd ed. London: SAGE Publications Ltd 2006.] (H) test of seasonality and Mann-Kendall (MK) test of trend were used [35Narayanan P, Basistha A, Sarkar S, Kamna S. Trend analysis and ARIMA modelling of pre-monsoon rainfall data for western India. C R Geosci 2013; 345: 22-7.
[http://dx.doi.org/10.1016/j.crte.2012.12.001] , 36Jones JR, Schwartz JS, Ellis KN, Hathaway JM, Jawdy CM. Temporal variability of precipitation in the Upper Tennessee Valley. J Hydrol 2015; 3: 125-38.]. It is important to study variability patterns of rainfall scales due to natural and environmental factors. In the study we have used a seasonal model and temporal trends of time series to explore the existing seasonal variations in the both the primary data and in predicted series of monthly and seasonal rainfall in Iran which is the major origin of environmental variations. The patterns were analyzed using variability calculates of multiplicative and additive models along the longitude and latitude for spatial patterns and the time patterns from 1975 to 2014 for temporal patterns. However, analysis of variability factors on rainfall changes was based on quantitative and statistical analyses with the integration of rainfall variability models of predictor elements on related variables [3Sayemuzzaman M, Jha MK. Seasonal and annual precipitation time series trend analysis in North Carolina, United States. Atmos Res 2014; 137: 183-94.
[http://dx.doi.org/10.1016/j.atmosres.2013.10.012] ]. STSM-SLS-GIS is a temporal-spatial technique that uses variability analysis [37Toros H. Spatio-temporal variation of daily extreme temperatures over Turkey. Int J Climatol 2012; 32: 1047-55.
[http://dx.doi.org/10.1002/joc.2325] ], STSM assessment, SLS, and GIS analysis to estimate the relationship between rainfall spatial patterns [21Brockwell PJ, Davis RA. Time series: theory and methods. Germany: Springer Science & Business Media 2013., 38Javari M. Quantitative Methods in Climatology (Seasonal Models). Payam Resan Press 2010; pp. 120-223.].
3.1. Measurement Methods
For assessment of residual normality on annual and seasonal time scale, the graphical and numerical means were used, applying Minitab and ArcGIS 10.3, based on each series for the analysis period (1975-2014). The following tests were used to check the normality of the rainfall series: Anderson-Darling, Kolmogorov-Smirnov, and Ryan-Joyner. The Anderson-Darling, Kolmogorov-Smirnov, and Ryan-Joyner tests are non-parametric statistical tests that check the normality hypothesis [34Kanji GK. 100 STATISTICAL TESTS. 3rd ed. London: SAGE Publications Ltd 2006., 39Balakrishnan N, Chimitova E, Vedernikova M. An empirical analysis of some nonparametric goodness-of-fit tests for censored data. Commun Stat Simul Comput 2014; 44: 1101-15.
[http://dx.doi.org/10.1080/03610918.2013.796982] ]. The Anderson-Darling test is used as a non-parametric test for normality measurement. The Kolmogorov-Smirnov test is introduced as a test for the deviation of empirical distribution from a theoretical distribution. The Ryan-Joyner test is used as a non-parametric test for normality measurement [21Brockwell PJ, Davis RA. Time series: theory and methods. Germany: Springer Science & Business Media 2013., 40North GR. STATISTICAL METHODS | Data Analysis: Time Series Analysis. In: Zhang GR, Ed. Encyclopedia of Atmospheric Sciences. 2nd ed. Oxford: Academic Press 2015; pp. 205-10.
[http://dx.doi.org/10.1016/B978-0-12-382225-3.00131-6] ]. This test considers normality by calculating the correlation between rainfall series and the normal scores of rainfall series [19Shumway RH, Stoffer DS. Time series analysis and its applications. Springer Science & Business Media 2013.]. If the correlation coefficient is about 1, the population is likely to be normal. To study the normality, the three tests of normality were calculated, and the results of some stations are presented. The study of normality and non-normality influences the recognition of trend in a series. With a normal distribution in the climatic series, the parametric tests may discover a trend in the climatic series. With a non-normality distribution in the climatic series, the nonparametric tests may distinguish a significant trend in the climatic series. Hence, every rainfall series is first checked for normality using statistical tests given in Eq. (1) at 5% significance level, applying one-tailed test. Anderson-Darling test was applied to check if rainfall series originate from a population with a normal distribution [41Grimaldi S, Kao SC, Castellarin A, et al. 2.18 - Statistical Hydrology. In: Wilderer P, Ed. Treatise on Water Science. Oxford: Elsevier 2011; pp. 479-517.
[http://dx.doi.org/10.1016/B978-0-444-53199-5.00046-4] ]. Anderson-Darling test is a one-sided test, and if the value of AD is greater than the critical value, normality hypothesis is rejected. In addition, Kolmogorov-Smirnov (K-S) test was applied to check the rainfall series with a normal distribution [21Brockwell PJ, Davis RA. Time series: theory and methods. Germany: Springer Science & Business Media 2013.]. Great amounts of KS suggest non-normality in the time series. Also, Shapiro-Wilk (SW) test was applied to check the rainfall series with a normal distribution [42Machiwal D, Jha MK. Hydrologic Time Series Analysis: Theory and Practice. New York, USA: Springer 2012.
[http://dx.doi.org/10.1007/978-94-007-1861-6] ]. Considering little values of the test-statistic, SW suggests a deviation from normal distribution. Based on the calculations of various trend recognition reviews, a comparative assessment could be performed. In addition, spatial-seasonal model capability and performing decision modeling and analysis are essential features of many climatic applications ranging from temporal precipitation variations to spatial precipitation variations [37Toros H. Spatio-temporal variation of daily extreme temperatures over Turkey. Int J Climatol 2012; 32: 1047-55.
[http://dx.doi.org/10.1002/joc.2325] ]. To study the use of spatial-seasonal models, two criteria were suggested: first, the parametric tests use spatial-seasonal forecasting; secondly, non-parametric tests use spatial-seasonal forecasting. Of the various time series tests employed to investigate time series rainfall, nonparametric and parametric trend tests are common. Thumb test was first established via obtaining the autocorrelation of the series. It was applied to check the rainfall series trend [26Javari M. Quantitative Methods in Climatology (Trend Models). Iran: Payam Resan Press 2010; pp. 30-70., 40North GR. STATISTICAL METHODS | Data Analysis: Time Series Analysis. In: Zhang GR, Ed. Encyclopedia of Atmospheric Sciences. 2nd ed. Oxford: Academic Press 2015; pp. 205-10.
[http://dx.doi.org/10.1016/B978-0-12-382225-3.00131-6] , 42Machiwal D, Jha MK. Hydrologic Time Series Analysis: Theory and Practice. New York, USA: Springer 2012.
[http://dx.doi.org/10.1007/978-94-007-1861-6] ]. The least square test was applied to check the seasonality of rainfall series (additive and multiplicative models) [24Becketti S. Introduction to time series using Stata. USA: Stata Press 2013., 26Javari M. Quantitative Methods in Climatology (Trend Models). Iran: Payam Resan Press 2010; pp. 30-70.]. For the selected stations and rainfall data in the study area, the least square seasonality test was used to distinguish the temporal trends and seasonality of the seasonal rainfall series. The nonparametric Kruskal-Wallis test was utilized on the seasonal rainfall, which is a serial version of one-factor analysis rank statistic [40North GR. STATISTICAL METHODS | Data Analysis: Time Series Analysis. In: Zhang GR, Ed. Encyclopedia of Atmospheric Sciences. 2nd ed. Oxford: Academic Press 2015; pp. 205-10.
[http://dx.doi.org/10.1016/B978-0-12-382225-3.00131-6] , 43Woody J. Time series regression with persistent level shifts. Stat Probab Lett 2015; 102: 22-9.
[http://dx.doi.org/10.1016/j.spl.2015.03.011] ]. Therefore, the null hypothesis that the data are from all rainfall series is rejected if
 is the critical test-statistic value with DF=n-1 and a significance level of α. The Mann-Kendall test as a nonparametric test was used in the annual time series and utilized as a test-statistic distribution [36Jones JR, Schwartz JS, Ellis KN, Hathaway JM, Jawdy CM. Temporal variability of precipitation in the Upper Tennessee Valley. J Hydrol 2015; 3: 125-38., 44Li X, Zhai G, Gao S, Shen X. Decadal trends of global precipitation in the recent 30 years. Atm Sci Le 2015; 16: 22-6.
[http://dx.doi.org/10.1002/asl2.514] ]. Therefore, in this study, the trends of rainfall data is investigated using the Mann-Kendall test and the slope (β) of trends which is intended by Theil (1950) and Sen (1968). Sen’s slope (β) is computed as the standard of all present slopes [3Sayemuzzaman M, Jha MK. Seasonal and annual precipitation time series trend analysis in North Carolina, United States. Atmos Res 2014; 137: 183-94.
[http://dx.doi.org/10.1016/j.atmosres.2013.10.012] , 45Santos M, Fragoso M. Precipitation variability in Northern Portugal: Data homogeneity assessment and trends in extreme precipitation indices. Atmos Res 2013; 131: 34-45.
[http://dx.doi.org/10.1016/j.atmosres.2013.04.008] ]. However, it is important to check the SSVTT properties of the series before making decision on the choice of trend impact. Therefore, SSVTT is regarded as a statistical method in climatology. This comprehensive analysis method has been widely applied for quantitative techniques and experiential analyses in climatic sciences [31Yue S, Pilon P, Cavadias G. Power of the Mann-Kendall and Spearman's rho tests for detecting monotonic trends in hydrological series. J Hydrol (Amst) 2002; 259: 254-71.
[http://dx.doi.org/10.1016/S0022-1694(01)00594-7] ]. To analyze the method for the discussion that follows, using Minitab, SYSTAT, and Matlab, a spatial and seasonal variations analysis model can be stated as follows. In this study, the variations of rainfall were assessed using spatial-seasonal and trend variations analysis, defined as the spatial-seasonal trend of rainfall in Iran. The rainfall condition at each season is measured by parametric and nonparametric tests of the seasonal variations models. In SSVTT, four types of patterns, i.e. multiplicative and additive models with trended and non-trended components as spatial-temporal patterns, are estimated. Multiplicative model is based on the assumption that the seasonal components of a time series are not necessarily independent and they can affect one another; however, in the additive model, it is assumed that the seasonal components are independent from each other. SSVTT is a quantitative spatial and temporal technique recognized as an essential calculating tool in climatic research. It comprises techniques to measure and determine the nature of the series and is frequently practical for forecasting and simulation of climatic elements, especially rainfall modeling [24Becketti S. Introduction to time series using Stata. USA: Stata Press 2013.]. In SSVTT, past precipitation data are collected and analyzed to develop a suitable mathematical model which captures the underlying data generation process for the time series-GIS. SSVTT is particularly useful when there is not enough knowledge about the rainfall patterns by the continuous series or when there is lack of an important exploratory-confirmatory model. SSVTT forecasting has important results regarding rainfall patterns [42Machiwal D, Jha MK. Hydrologic Time Series Analysis: Theory and Practice. New York, USA: Springer 2012.
[http://dx.doi.org/10.1007/978-94-007-1861-6] ]. There are two widely used SSVTT models in climate, viz., multiplicative (trended and non-trended) and additive (trended and non-trended) models [46Shiau J-T, Huang W-H. Detecting distributional changes of annual rainfall indices in Taiwan using quantile regression. J Hydro-environ Res 2015; 9: 368-80.
[http://dx.doi.org/10.1016/j.jher.2014.07.006] , 47Ghasemi AR. Changes and trends in maximum, minimum and mean temperature series in Iran. Atmos Sci Lett 2015; 16: 366-72.
[http://dx.doi.org/10.1002/asl2.569] ]. SSVTT models have high importance in modeling and forecasting precipitation [48Mohammadi H, Javari M. Precipitation changes of Iran.. Available from: https://www.researchgate.net/publication/289190716_Precipitation_ changes_of_Iran 2007.]. This section provides a background for the trend-seasonal pattern in Iran precipitation series, in which trended and non-trended models used for precipitation forecasting are studied. However, there are two approaches to estimate the variations in spatial and temporal variations analysis model. The most widely applied approach is SSVTT modeling technique which is used in this study. The STMS-SLS forecasting and modeling methods include three patterns (additive, multiplicative, and updating models) [26Javari M. Quantitative Methods in Climatology (Trend Models). Iran: Payam Resan Press 2010; pp. 30-70., 41Grimaldi S, Kao SC, Castellarin A, et al. 2.18 - Statistical Hydrology. In: Wilderer P, Ed. Treatise on Water Science. Oxford: Elsevier 2011; pp. 479-517.
[http://dx.doi.org/10.1016/B978-0-444-53199-5.00046-4] ]. A new SSVTT technique is suggested based on temporal-spatial pattern, which relates the principles of seasonal-trend analysis with spatial pattern [49Farnum NR, Stanton LW. Quantitative Forecasting Methods. Boston: PWS-Kent Pub. Co. 1989.]. Thus, the new quantitative technique not only forms a spatial-seasonal-trend pattern [50Sanders NR. Quantitative forecasting methods. Int J Forecast 1990; 6: 258-9.
[http://dx.doi.org/10.1016/0169-2070(90)90014-3] ], but also ensures the importance of the technique related to dependent variables. This method involves the following steps: 1) concept explanation in STSM model, 2) examining the rainfalls series’ normality and measurement of the rainfalls series, 3) selecting tests in the rainfalls series analysis to forecast rainfall changes, 4) selection and initialization of the models’ accuracy in measuring models, 5) studying the reliability of analysis model, 6) studying the reliability of prediction model, 7) determining the distribution of rainfalls series in STSM-SLS analysis [21Brockwell PJ, Davis RA. Time series: theory and methods. Germany: Springer Science & Business Media 2013.] and forecasting models by software, 8) measuring the spatial patterns, 9) examining spatial modeling, and 10) drawing the rainfalls series spatial-seasonal variations’ maps. The maps of rainfalls series variations in Iran were provided with a higher accuracy using this method. Finally, the spatial-seasonal-trend variations maps of rainfall were drawn. Spatial-seasonal-trend variations analysis of the rainfall allows us to model, examine, and explore spatial relationships and explain factors affecting spatial patterns [51Evrendilek F, Ertekin C. Statistical modeling of spatio-temporal variability in monthly average daily solar radiation over Turkey. Sensors (Basel Switzerland) 2007; 7: 2763-78.
[http://dx.doi.org/10.3390/s7112763] , 52Johnston K, Ver Hoef JM, Krivoruchko K, Lucas N. Using ArcGIS geostatistical analyst: USA Esri Redlands; 2001.]. STSM -SLS-GIS model was introduced, and its applicability in climatic rainfalls series processing was validated by a case study to identify the monthly and seasonal rainfall related to rainfall seasonal change patterns in Iran. Distribution of rainfalls series of the STSM-SLS analysis and forecasted series to spatial-temporal models were presented, consisting of spatial autocorrelation procedure (Moran's I Index value) [53ESRI. Using ArcGIS geostatistical analyst: Esri Redlands. United States of America 2014.]. Geostatistical method was selected for spatial distribution of rainfalls series (additive or multiplicative models). Trend spatial analyses of additive and ordinary least squares and multiplicative models with GIS were conducted [53ESRI. Using ArcGIS geostatistical analyst: Esri Redlands. United States of America 2014.]. Many time series methods in climatology display various constructs in their statistics. STSM-SLS-GIS is an important tool used to reveal the seasonality and trend patterns of various constructs at many different scales in time. In the next stage, according to the evaluation of the performance of various [54Voyant C, Haurant P, Muselli M, Paoli C, Nivet M-L. Time series modeling and large scale global solar radiation forecasting from geostationary satellites data. Sol Energy 2014; 102: 131-42.
[http://dx.doi.org/10.1016/j.solener.2014.01.017] , 55Fares A, Awal R, Michaud J, et al. Rainfall-runoff modeling in a flashy tropical watershed using the distributed HL-RDHM model. J Hydrol (Amst) 2014; 519(Part D): 3436-47.
[http://dx.doi.org/10.1016/j.jhydrol.2014.09.042] ] prediction methods, mean error (ME), mean absolute error (MAE), mean relative errors (MRE), mean squared error (MSE), and root mean squared errors (RMSE) of the predicted series were computed [56Oliver MA, Webster R. Basic Steps in Geostatistics: The Variogram and Kriging. USA: Springer 2015.]. Hence, a selective index is based on comparing the model with competitor models, and parsimonious model’s selection index is dependent on the desired parameters of the researcher. MAD measure forecasts accuracy by averaging the magnitudes of the forecast errors [42Machiwal D, Jha MK. Hydrologic Time Series Analysis: Theory and Practice. New York, USA: Springer 2012.
[http://dx.doi.org/10.1007/978-94-007-1861-6] ]. It measures the average absolute deviation of forecasted values from original values. It shows the magnitude of overall error due to forecasting. For a good forecast, the obtained MAE should be as small as possible. According to the validation indicators, the mean square error (MSE), the mean absolute error (MAE), the root mean square error (RMSE) between the predicted and original values of rainfall series are analyzed.
3.2. Spatial Autocorrelation Indices
To explore the spatial distribution of trends on monthly and seasonal basis, the linear regression slope [57Babazadeh A, Javari M. Regression analysis of climatically data with selected stations of Iran. Geo Reg Plan 2010; 1: 95-108.] was interpolated using ArcGIS 10.3 [58Javari M. Geostatistical and spatial statistical modelling of precipitation variations in Iran. J Civil Environ Eng 2016; 6: 2.
[http://dx.doi.org/10.4172/2165-784X.1000230] ] according to each series slope value for the entire study period (1975-2014). Moran's I indices were used to evaluate spatial patterns of distribution of stations, considering their location and correlation values. This method uses a measure known as the spatial autocorrelation coefficient to measure and test how observed locations are clustered, dispersed, and randomized in space with respect to correlation values between rainfall series and the data period in Iran. The value of Moran's I statistic ranges from +1, indicating clustering of the data values to -1 indicating dispersed pattern of the data values [53ESRI. Using ArcGIS geostatistical analyst: Esri Redlands. United States of America 2014.]. In the Moran's I statistic, the results are always interpreted within the context of null hypothesis. Positive Moran's I statistic with significant P-values and high Z scores indicate spatially clustered data sets. At the same time, negative Moran's I depicts that the spatial pattern is more spatially dispersed [36Jones JR, Schwartz JS, Ellis KN, Hathaway JM, Jawdy CM. Temporal variability of precipitation in the Upper Tennessee Valley. J Hydrol 2015; 3: 125-38., 59Duhan D, Pandey A. Statistical analysis of long term spatial and temporal trends of precipitation during 1901-2002 at Madhya Pradesh, India. Atmos Res 2013; 122: 136-49.
[http://dx.doi.org/10.1016/j.atmosres.2012.10.010] , 60Luković J, Blagojevć D, Kilibarda M, Bajat B. Spatial pattern of north atlantic oscillation impact on rainfall in serbia. Spatial Stat 2015; 14: 39-52.
[http://dx.doi.org/10.1016/j.spasta.2015.04.007] ].
3.3. Forecast Model for Seasonality and Trend of Precipitation
The least squares models derived from the seasonality were used, but then re-validation of the additive model's parameters in a specific forecast mode was carried out for every period when new information became available. For each season, there were three different statistical models (seasonal, trended seasonal, and non-trended seasonal), and MAD, MSE, and RMSE were used as validity criteria for each. The forecast accuracy was assessed using several stages. Moreover, geostatistcal analysis was used to forecast the rainfall value for the previous period [37Toros H. Spatio-temporal variation of daily extreme temperatures over Turkey. Int J Climatol 2012; 32: 1047-55.
[http://dx.doi.org/10.1002/joc.2325] ]. The least squares method can be used not only to test seasonality, but also to fit the trended or non-trended seasonal models to Iran rainfall. The spatial-seasonal forecasts using least squares for precipitation in Iran with additive models are presented in section 3. The forecast model is a least squares method for seasonality estimation and precipitation variations [61Powell EJ, Keim BD. Trends in Daily Temperature and Precipitation Extremes for the Southeastern United States: 1948-2012. J Clim 2014; 28: 1592-612.
[http://dx.doi.org/10.1175/JCLI-D-14-00410.1] ]. Since the additive model of seasonality has an acceptable condition, the measuring model has an appropriate quality.
4. RESULTS AND DISCUSSION
In Iran, rainfall is shown significant seasonal variations, i.e., the quantity and concentration of rainfall is frequently determined in a particular cycle of a year. The coefficient of variation is ranged between 0.05% (Hamadan Foroudgah station) and 39.84% (Bandar Anzali station). The average coefficient of variation in Iran is 4.5%. The results show that in Iran, the frequent rainfall variability is located in the area of most extreme rainfall, and the area of lowest rainfall is in lowest variability area. Thumb test was first established via obtaining the autocorrelation of the series. It was applied to check the rainfall series trend. Table 2 displays the Thumb test for forecasting and the modeling methods.


However, in designing a prediction model, testing the model is performed along with testing the parametric and non-parametric tests [41Grimaldi S, Kao SC, Castellarin A, et al. 2.18 - Statistical Hydrology. In: Wilderer P, Ed. Treatise on Water Science. Oxford: Elsevier 2011; pp. 479-517.
[http://dx.doi.org/10.1016/B978-0-444-53199-5.00046-4] , 63Dingman SL. Physical hydrology. USA: Waveland press 2015.]. Studies have been conducted on the reliability and validity of measuring tools, testing the forecasting models, and the relationships of rainfall temporal patterns as seasonal indices in Iran. Hence, SLS method includes two analysis and forecasting models [48Mohammadi H, Javari M. Precipitation changes of Iran.. Available from: https://www.researchgate.net/publication/289190716_Precipitation_ changes_of_Iran 2007., 64Javari M. Climate changes of temperature and precipitation in Iran: PhD Thesis. Tehran University; 2001.]. The analysis model includes the study of past and present seasonal variations for identifying the variations’ patterns. To study the rainfall past and present seasonal variability, two models for the analysis of rainfall series were calculated. To evaluate the patterns of rainfall on structure temporal-seasonal variations and to incorporate the seasonality model [65Livada I, Asimakopoulos D. Individual seasonality index of rainfall regimes in Greece. Clim Res 2005; 28: 155-61.
[http://dx.doi.org/10.3354/cr028155] ] into STSM-SLS model, the rainfalls series from previous models were extracted, and the forecasted precipitation variations by seasonal analysis variations model were plotted (Fig. 4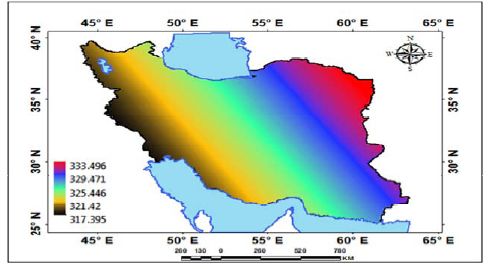 ).
).
 |
Fig. (4) The spatial-seasonal trend forecasting of Iran precipitation. |
In addition to STSM-SLS-GIS data, SSVTT model was extracted, and the estimated precipitation variations were plotted. Considerable differences between the analysis model and forecasted model values are related to the complexity of precipitation patterns variations. The findings of this research showed that in the spatial-seasonal variations analysis model, additive variations patterns of precipitation had the largest effect on precipitation [64Javari M. Climate changes of temperature and precipitation in Iran: PhD Thesis. Tehran University; 2001.]. In studying the effects of spatial-seasonal variations on Iran precipitation, two factors, namely spatial precipitation variations and temporal precipitation variations, had significant effects in view of the SSVTT models. There are significant coefficients in the variation amount of rainfall based on MK values ranging from -3.98 to 1.996 and annual variability. There is high variation in Babolsar station with 1.996 and less variation in Bijar station ranging from 3.98 to 1.996. The rainfall trend coefficient of variability ranged from 0.03% to -143.84% in annual scale. In the Miandeh Jiroft station, the trend coefficient of variability is higher in the north and west of Iran, and it is lower in the west and north-west part of Iran. In the Caspian Sea coast, the value is relatively higher than west of Iran, whereas at central part of Iran, the value is lower. Sen’s slope (β) is computed as the standard of all slopes (Table 6). Only 28 positive (stations 20%), 110 negative (stations 78.57%) trends and two non-trends (stations 1.43%) were predicted to be significant at 95% confidence level, varying from -29.158 to 5.87 mm yr-1.

There were various confidence levels of temporal trend in annual and minimum confidence levels of temporal trend in annual values ranging from -45.04 to 0.065 mm with annual variation. Maximum confidence levels of temporal trend in annual values ranged from -4.73 to 19.61 regarding annual variability. There are lower minimum confidence levels of temporal trend in Marivan station with -45.04 mm and higher variation in Babolsar station with 0.065mm. There are high maximum confidence levels of temporal trend in Lordeghan station with 19.6 mm and less variation in Zarghan station with 4.73 mm. The trend of minimum coefficient of confidence levels is higher in the east of Iran and is lower in the west. The trend of maximum coefficient of confidence levels is higher in south-west of Iran and lower in the center and east. Fig. (5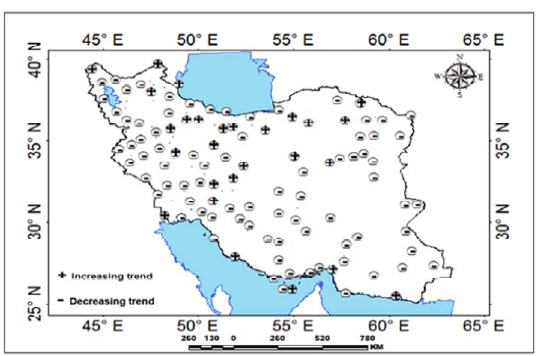 ) shows that the stations’ downward trend decreases with increase of longitude and decrease of latitude, and upward trend decreases with increase of longitude and decrease of latitude. Also, the application of STMS-SLS in predicting rainfall variability and the evaluation of the impact of SSVTT on the climate change are taken into account by various investigators.
The research reported here used the SSVTT model. For SSVTT, the seasonal rainfall variability is easily computed from time series data. The decomposition of time series components was used in the current study. Decomposition creates three sets of stages: rainfall time series stage that indicates the original series with the fitted trend line, predicted values, and forecasts; rainfall series are analyses in separate stages, the no-trended series of the seasonally adjusted data and the seasonally adjusted and non-trended series (the residuals). Pearson’s r between the seasonal component and the non-trended rainfall time series was 0.991, presenting a suitable estimate of the seasonal variations. Also, Pearson’s r between the seasonal component and the trended rainfall time series was 0.997, presenting a good fit estimate of the seasonal and trended variations. The coefficient of seasonal and non-trended variation was 1.2, with a lower deviation of 0.01. This showed that the seasonal series’ fluctuation around trend was undoubtedly associated to the rainfall variability patterns. In addition, average rainfall series at annual scale in Iran were discovered to respect variability patterns, given their histogram figures and confidence of their statistics amounts. On average, in Iran, monthly rainfall oscillated from 2.65 to 3.93 mm in February and from 8.07 to 86.25 mm in December. Three best-fit normality models (winter) for each geographical month of Iran and their validity compared to the independent series are represented in Fig. (6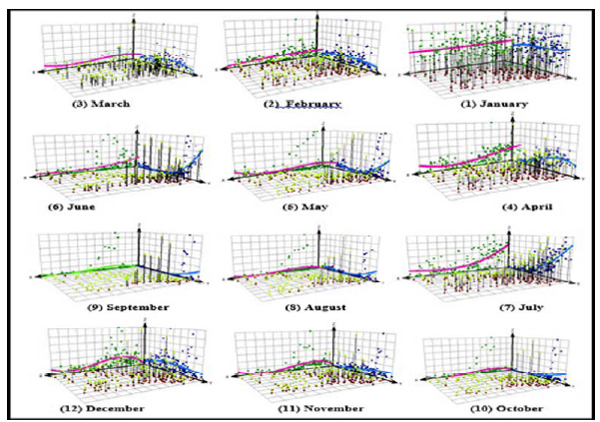 ). Four patterns (North-West, South-East, North-South, West-East, and South-West– East-North) for each monthly rainfall distribution and their validity compared to the independent series are depicted in Fig. (6). About 58.34 percent of areas in Iran is under north-west and south-east pattern influence of monthly rainfall (January, February, March, May, June, April, and November), 25 percent under the north-south pattern effect of monthly rainfall (August, September, and December), 8.33 percent under the west-east pattern influence of monthly rainfall (July), and 8.33 percent under the south-west and north-east pattern effect of monthly precipitation (October).
 |
Fig. (5) Stations trend distribution of rainfall in Iran. |

The winter and autumn seasons show the increasing general rainfall seasonal fluctuations. Spatial-seasonal patterns show that rainfall series point out one reason for the absence of acceptable relationships over the long term between quantity of rainfall, spatial distribution of rainfall, and seasonal rainfall variations patterns. Because extreme rainfall variations can either cause serious decreases in water resources, the non-trended effects of extreme infrequent events preclude any consistent statistical relationship between rainfall and seasonal variations patterns. It is logical to consider that there are other non-trended (some parts of Iran) and trended (some parts of Iran) relationships that further complicate the relationships between rainfall and their seasonal deviations patterns. The result is that the seasonal model is likely to capture realistically the large number of climatic variables and environmental processes that affect climatic dynamics. The seasonal changes’ slope of Iran precipitation (with additive model) differed between 0.921 and 1.165 mm in each season per period. In seasonal time series, the magnitude of seasonal rainfall changes ranges varied 0.244 mm in each season per period (Table 6). The range of seasonal magnitude in spring rainfall fluctuated between 0.339 and 0.625 mm in the season per period. Rainfall seasonal changes rate, with confidence level of 95 percent, is 0.019 mm in the season per period. The variations of seasonal magnitude in summer rainfall fluctuated between 0.134 and 0.167 mm in the season per period. Rainfall seasonal change with confidence level of 95 percent was 0.002 mm in the season per period. The range of seasonal magnitude in autumn rainfall fluctuated between 0.678 and 0.921 mm in the season per period. It is recognized that rainfall seasonal change, with a confidence level of 95 percent, is 0.016 mm in the season per period. Also, the findings showed that among the rainfall spatial models, the additive pattern had the largest effect on rainfall. The Mann-Kendall's test results showed a trend of monthly rainfall in Iran; 67 stations showed a statistically significant decreasing trend. The seasonal analysis trend indicated a general trend-seasonal pattern in the rainfall data in the north-east to south-west and north-to-south direction of Iran (Table 7).

In addition, the significant effect of the rainfall semivariograms patterns are similar for seasons cluster patterns (Fig. 7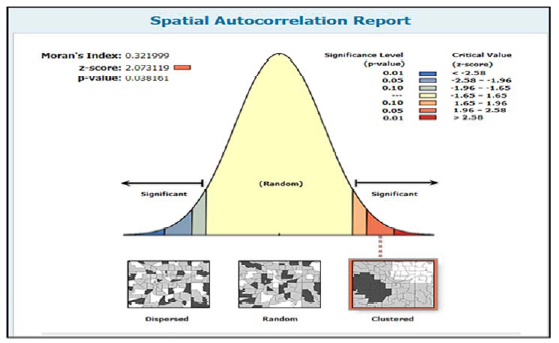 ).
).
 |
Fig. (7) Spatial autocorrelation (moran’s index) of monthly rainfall. |
Surface maps of modeling spatial relationships (all Moran's I statistics calculated for monthly periods indicate statistical significance, P<0.001, clustered spatial patterns of correlation coefficients for all periods) over Iran rainfall modeling spatial relationships were generated with a grid resolution of 400 m x 400 m (Fig. 8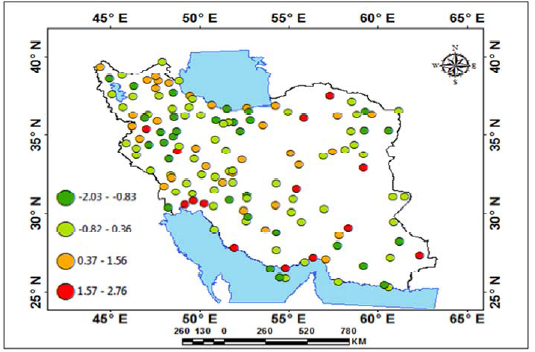 ).
).
 |
Fig. (8) Distribution of statistically significant (moran’s index) of monthly rainfall. |
The spatial-seasonal variations of overall rainfall in Iran are complex. Winter months typically yield the highest overall rainfall in the north and west zones while the eastern zones are at their driest state. Autumn tends to be wet in the western mountains, but driest toward the southeast corner of Iran. Moisture transport spatial-temporal variations from the Oman Sea as well as from southerly flows contribute most strongly to average rainfall across the eastern and southern zones during the summer and least to the rainfall in the northern zones. The seasonal and spatial distributions of rainfall extremes diverge notably from those of seasonal patterns in the west and north areas of Iran. Moreover, in temporal and spatial variations distribution of rainfall extremes diverge notably from spatial-seasonal patterns shows three regions around the Khazar Sea shore, mountainous zones (Zaghros and Alborz), and central zones which have specific seasonal patterns. The spatial-seasonality of rainfall extremes in Iran, Khazar Sea shore, and mountainous zones (Zaghros and Alborz) are complex, with intense rainfall events occurring in all months, and stations within the zones show significantly different monthly and seasonal distributions of spatial-seasonal and trend variations patterns (Fig. 9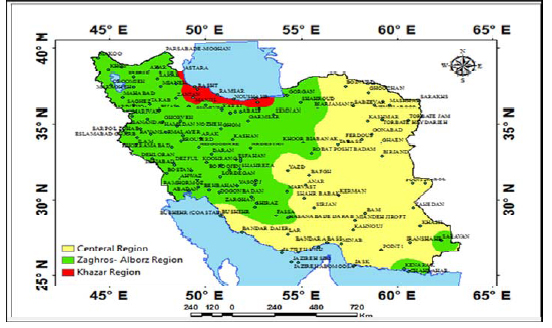 ).
).
 |
Fig. (9) Regions of spatial-seasonal and trend variations of Iran rainfall. |
The spatial-seasonal trend assessment was conducted through applying seasonal statistics (measurement, analysis, forecast, and control) on the rainfall time series within each region over the period 1975-2014. Fig. (10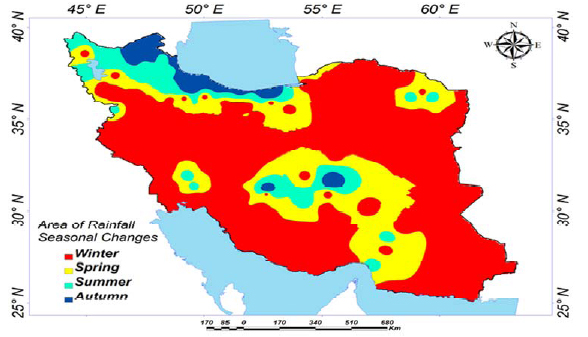 ) shows that rainfall spatial-seasonal variations are significant (maximum extended of winter rainfall). In monthly and seasonal time series, the magnitude of rainfall seasonal variations varies from 0.134 to 1.165 mm in the periods and from 0.921 to 1.165 mm in the season.
 |
Fig. (10) Area of rainfall seasonal changes models in Iran. |
It was found that seasonal rainfall forecast (additive-least squares) has been decreasing in the center and south of Iran over the last 35 years. Seasonal rainfall variations have been increasing in the mountains and Khazar Sea shore over the last 35 years. The analysis shows the seasonal variations results on monthly and seasonal rainfall time series for Khazar Sea shore regions. Overall, spatial rainfall seasonal variations decrease in summer time series. In summer, almost all three regions show decreasing rainfall seasonal changes from the period around 1975 to 2014. The major findings of this study can be summarized as follows: 1) the spatial distributions and continuity of the rainfall data were modeled at different time periods. Seasonal variations procedures of time series were applied to test the validity of different models. The results showed that in the autumn and winter the atmospheric systems (western winds) influence is dominant and rainfall is during winter as a result of the western winds effect, and is widespread throughout the country during the winter. Local conditions are predominant in summer in the southeast of Iran, where the autumn rainfall is in a transitional phase between summer and winter conditions. It is concluded that the seasonal changes technique lends itself well to represent rainfall patterns in different seasons. The analysis of seasonal rainfall showed that the maximum amount of rainfall necessarily occurs at seasonal changes. Spring and summer rainfalls are related to local seasonal and monthly circulation and winter rainfall is related to the atmospheric systems interaction. Hence, the rainfall spatial and temporal relationship can be better evaluated by seasonality due to different climate conditions. 2) The seasonal variations area was also calculated for all four seasons. There are spatial and temporal variations in estimation of seasonal models of Iran. These variations are the result of several factors, such as high variability in summer and spring rainfall compared to somewhat low variability in rainfall during winter and autumn.
CONCLUSION
The seasonal rainfall series within a period of 1975-2014 displayed spatial-seasonal variability and temporal trends with increasing and decreasing trends. The spatial-seasonal variability and temporal trends displayed, respectively, rainfall regionalization variability with increasing and decreasing trends in Iran. The distribution of the spatial-seasonal variability and temporal trends varied due to regional indicated climate variability with downward trends decreasing in the west region, mostly situated in the north-west and north. The findings of this research showed that among the rainfall spatial models, the additive pattern had the largest effect on rainfall. The seasonal analysis trend indicated a general trend-seasonal pattern in the rainfall data in the north-east to south-west and north-to-south directions. The seasonal and spatial distributions of rainfall extremes diverge notably from those of seasonal patterns in the west and north areas of Iran.
CONFLICT OF INTEREST
The author declare they has no competing interest. I declare that I have no significant competing financial, professional or personal interests that might have influenced the performance or presentation of the work described in this manuscript.
ACKNOWLEDGEMENTS
This research was supported by Grant meeting at PayameNoor University. We also thank PayameNoor management and research committee of PayameNoor University.
REFERENCES
| [1] | de Luis M, Čufar K, Saz M, Longares L, Ceglar A, Kajfež-Bogataj L. Trends in seasonal precipitation and temperature in Slovenia during 1951-2007. Reg Environ Change 2014; 14: 1801-10. [http://dx.doi.org/10.1007/s10113-012-0365-7] |
| [2] | Liu H, Tian H-q, Pan D-f, Li Y-f. Forecasting models for wind speed using wavelet, wavelet packet, time series and Artificial Neural Networks. Appl Energy 2013; 107: 191-208. [http://dx.doi.org/10.1016/j.apenergy.2013.02.002] |
| [3] | Sayemuzzaman M, Jha MK. Seasonal and annual precipitation time series trend analysis in North Carolina, United States. Atmos Res 2014; 137: 183-94. [http://dx.doi.org/10.1016/j.atmosres.2013.10.012] |
| [4] | Yao Z, Liu Z, Huang H, Liu G, Wu S. Statistical estimation of the impacts of glaciers and climate change on river runoff in the headwaters of the Yangtze River. Quat Int 2014; 336: 89-97. [http://dx.doi.org/10.1016/j.quaint.2013.04.026] |
| [5] | Khashei M, Rafiei FM, Mirahmadi A. Seasonal interval time series models in comparative study of industrial forecasting. Int J Curr Trends Eng Technol 2015; I(II). |
| [6] | Longobardi A, Mautone M. Trend Analysis of Annual and Seasonal Air Temperature Time Series in Southern Italy. In: Lollino G, Arattano M, Rinaldi M, Giustolisi O, Marechal J-C, Grant GE, Eds. Engineering Geology for Society and Territory -. Springer International Publishing 2015; Vol. 3: pp. 501-4. [http://dx.doi.org/10.1007/978-3-319-09054-2_102] |
| [7] | Maussion F, Scherer D, Mölg T, Collier E, Curio J, Finkelnburg R. Precipitation seasonality and variability over the tibetan plateau as resolved by the high asia reanalysis*. J Clim 2013; 27: 1910-27. [http://dx.doi.org/10.1175/JCLI-D-13-00282.1] |
| [8] | Valencia J, Olivar G, Franco CJ, Dyner I. Qualitative Analysis of Climate Seasonality Effects in a Model of National Electricity Market. In: Vasilieva O, Ed. Analysis, Modelling, Optimization, and Numerical Techniques. Tost, GO: Springer International Publishing 2015; pp. 349-62. [http://dx.doi.org/10.1007/978-3-319-12583-1_24] |
| [9] | Delavau C, Chun KP, Stadnyk T, Birks SJ, Welker JM. North American precipitation isotope (δ18O) zones revealed in time series modeling across Canada and northern United States. Water Resour Res 2015; 51: 1284-99. [http://dx.doi.org/10.1002/2014WR015687] |
| [10] | Mahoney K, Ralph FM, Wolter K, et al. Climatology of extreme daily precipitation in Colorado and its diverse spatial and seasonal variability. J Hydrometeorol 2014; 16: 781-92. [http://dx.doi.org/10.1175/JHM-D-14-0112.1] |
| [11] | Gundogdu I. Usage of multivariate geostatistics in interpolation processes for meteorological precipitation maps. Theor Appl Climatol 2015; 1-6. [http://dx.doi.org/10.1007/s00704-015-1619-3] |
| [12] | Ghoraba SM. Hydrological modeling of the Simly Dam watershed (Pakistan) using GIS and SWAT model. Alexandria Eng J 54(3): 583-94. [http://dx.doi.org////dx.doi.org/10.1016/j.aej.2015.05.018] |
| [13] | Pereira P, Oliva M, Misiune I. Spatial interpolation of precipitation indexes in Sierra Nevada (Spain): comparing the performance of some interpolation methods. Theor Appl Climatol 2016; 126(3): 683-98. |
| [14] | Goyal MK, Singh V, Meena AH. Geospatial and hydrological modeling to assess hydropower potential zones and site location over rainfall dependent Inland catchment. Water Res Mana 2015; 29: 2875-94. [http://dx.doi.org/10.1007/s11269-015-0975-1] |
| [15] | Ifeka A, Akinbobola A. Trend analysis of precipitation in some selected stations in anambra state. Atmos Clim Sci 2015; 5: 1. [http://dx.doi.org/10.4236/acs.2015.51001] |
| [16] | Javari M. A study of impacts of temperature components on precipitation in Iran using SEM-PLS-GIS. J Earth Sci Clim Change 2015. [http://dx.doi.org/10.4172/2157-7617.S3-004] |
| [17] | Pascale S, Lucarini V, Feng X, Porporato A, Hasson Su. Analysis of rainfall seasonality from observations and climate models. Clim Dyn 2015; 44: 3281-301. [http://dx.doi.org/10.1007/s00382-014-2278-2] |
| [18] | Tabari H, Somee BS, Zadeh MR. Testing for long-term trends in climatic variables in Iran. Atmos Res 2011; 100: 132-40. [http://dx.doi.org/10.1016/j.atmosres.2011.01.005] |
| [19] | Shumway RH, Stoffer DS. Time series analysis and its applications. Springer Science & Business Media 2013. |
| [20] | Singh D, Glupta RD, Jain SK. Statistical analysis of long term spatial and temporal trends of temperature parameters over Sutlej river basin, India. J Earth Syst Sci 2015; 124: 17-35. [http://dx.doi.org/10.1007/s12040-014-0530-0] |
| [21] | Brockwell PJ, Davis RA. Time series: theory and methods. Germany: Springer Science & Business Media 2013. |
| [22] | Javari M. Spatial neighborhood analysis of the monthly rainfall in Iran. Geoinform Geostat 2015; 3: 15. |
| [23] | Some'e BS, Ezani A, Tabari H. Spatiotemporal trends and change point of precipitation in Iran. Atmos Res 2012; 113: 1-12. [http://dx.doi.org/10.1016/j.atmosres.2012.04.016] |
| [24] | Becketti S. Introduction to time series using Stata. USA: Stata Press 2013. |
| [25] | Farnum. R.Nicholas, Staton LW. Quantitative Forecasting Methods (The Duxbury series in statistics and decision sciences). Pws Pub Co 1989; 1989: 315-93. |
| [26] | Javari M. Quantitative Methods in Climatology (Trend Models). Iran: Payam Resan Press 2010; pp. 30-70. |
| [27] | Shirvani A. Change point analysis of mean annual air temperature in Iran. Atmos Res 2015; 160: 91-8. [http://dx.doi.org/10.1016/j.atmosres.2015.03.007] |
| [28] | Muhire I, Ahmed F. Spatio-temporal trend analysis of precipitation data over Rwanda. S Afr Geogr J 2015; 97: 50-68. [http://dx.doi.org/10.1080/03736245.2014.924869] |
| [29] | Shi P, Wu M, Qu S, et al. Spatial distribution and temporal trends in precipitation concentration indices for the southwest China. Water Resour Manage 2015; 29: 3941-55. [http://dx.doi.org/10.1007/s11269-015-1038-3] |
| [30] | Roy SS, Rouault M. Spatial patterns of seasonal scale trends in extreme hourly precipitation in South Africa. Appl Geogr 2013; 39: 151-7. [http://dx.doi.org/10.1016/j.apgeog.2012.11.022] |
| [31] | Yue S, Pilon P, Cavadias G. Power of the Mann-Kendall and Spearman's rho tests for detecting monotonic trends in hydrological series. J Hydrol (Amst) 2002; 259: 254-71. [http://dx.doi.org/10.1016/S0022-1694(01)00594-7] |
| [32] | Hirsch RM, Slack JR. A nonparametric trend test for seasonal data with serial dependence. Water Resour Res 1984; 20: 727-32. [http://dx.doi.org/10.1029/WR020i006p00727] |
| [33] | Mann HB. Nonparametric tests against trend. Econometrica 1945; 13: 245-59. [http://dx.doi.org/10.2307/1907187] |
| [34] | Kanji GK. 100 STATISTICAL TESTS. 3rd ed. London: SAGE Publications Ltd 2006. |
| [35] | Narayanan P, Basistha A, Sarkar S, Kamna S. Trend analysis and ARIMA modelling of pre-monsoon rainfall data for western India. C R Geosci 2013; 345: 22-7. [http://dx.doi.org/10.1016/j.crte.2012.12.001] |
| [36] | Jones JR, Schwartz JS, Ellis KN, Hathaway JM, Jawdy CM. Temporal variability of precipitation in the Upper Tennessee Valley. J Hydrol 2015; 3: 125-38. |
| [37] | Toros H. Spatio-temporal variation of daily extreme temperatures over Turkey. Int J Climatol 2012; 32: 1047-55. [http://dx.doi.org/10.1002/joc.2325] |
| [38] | Javari M. Quantitative Methods in Climatology (Seasonal Models). Payam Resan Press 2010; pp. 120-223. |
| [39] | Balakrishnan N, Chimitova E, Vedernikova M. An empirical analysis of some nonparametric goodness-of-fit tests for censored data. Commun Stat Simul Comput 2014; 44: 1101-15. [http://dx.doi.org/10.1080/03610918.2013.796982] |
| [40] | North GR. STATISTICAL METHODS | Data Analysis: Time Series Analysis. In: Zhang GR, Ed. Encyclopedia of Atmospheric Sciences. 2nd ed. Oxford: Academic Press 2015; pp. 205-10. [http://dx.doi.org/10.1016/B978-0-12-382225-3.00131-6] |
| [41] | Grimaldi S, Kao SC, Castellarin A, et al. 2.18 - Statistical Hydrology. In: Wilderer P, Ed. Treatise on Water Science. Oxford: Elsevier 2011; pp. 479-517. [http://dx.doi.org/10.1016/B978-0-444-53199-5.00046-4] |
| [42] | Machiwal D, Jha MK. Hydrologic Time Series Analysis: Theory and Practice. New York, USA: Springer 2012. [http://dx.doi.org/10.1007/978-94-007-1861-6] |
| [43] | Woody J. Time series regression with persistent level shifts. Stat Probab Lett 2015; 102: 22-9. [http://dx.doi.org/10.1016/j.spl.2015.03.011] |
| [44] | Li X, Zhai G, Gao S, Shen X. Decadal trends of global precipitation in the recent 30 years. Atm Sci Le 2015; 16: 22-6. [http://dx.doi.org/10.1002/asl2.514] |
| [45] | Santos M, Fragoso M. Precipitation variability in Northern Portugal: Data homogeneity assessment and trends in extreme precipitation indices. Atmos Res 2013; 131: 34-45. [http://dx.doi.org/10.1016/j.atmosres.2013.04.008] |
| [46] | Shiau J-T, Huang W-H. Detecting distributional changes of annual rainfall indices in Taiwan using quantile regression. J Hydro-environ Res 2015; 9: 368-80. [http://dx.doi.org/10.1016/j.jher.2014.07.006] |
| [47] | Ghasemi AR. Changes and trends in maximum, minimum and mean temperature series in Iran. Atmos Sci Lett 2015; 16: 366-72. [http://dx.doi.org/10.1002/asl2.569] |
| [48] | Mohammadi H, Javari M. Precipitation changes of Iran.. Available from: https://www.researchgate.net/publication/289190716_Precipitation_ changes_of_Iran 2007. |
| [49] | Farnum NR, Stanton LW. Quantitative Forecasting Methods. Boston: PWS-Kent Pub. Co. 1989. |
| [50] | Sanders NR. Quantitative forecasting methods. Int J Forecast 1990; 6: 258-9. [http://dx.doi.org/10.1016/0169-2070(90)90014-3] |
| [51] | Evrendilek F, Ertekin C. Statistical modeling of spatio-temporal variability in monthly average daily solar radiation over Turkey. Sensors (Basel Switzerland) 2007; 7: 2763-78. [http://dx.doi.org/10.3390/s7112763] |
| [52] | Johnston K, Ver Hoef JM, Krivoruchko K, Lucas N. Using ArcGIS geostatistical analyst: USA Esri Redlands; 2001. |
| [53] | ESRI. Using ArcGIS geostatistical analyst: Esri Redlands. United States of America 2014. |
| [54] | Voyant C, Haurant P, Muselli M, Paoli C, Nivet M-L. Time series modeling and large scale global solar radiation forecasting from geostationary satellites data. Sol Energy 2014; 102: 131-42. [http://dx.doi.org/10.1016/j.solener.2014.01.017] |
| [55] | Fares A, Awal R, Michaud J, et al. Rainfall-runoff modeling in a flashy tropical watershed using the distributed HL-RDHM model. J Hydrol (Amst) 2014; 519(Part D): 3436-47. [http://dx.doi.org/10.1016/j.jhydrol.2014.09.042] |
| [56] | Oliver MA, Webster R. Basic Steps in Geostatistics: The Variogram and Kriging. USA: Springer 2015. |
| [57] | Babazadeh A, Javari M. Regression analysis of climatically data with selected stations of Iran. Geo Reg Plan 2010; 1: 95-108. |
| [58] | Javari M. Geostatistical and spatial statistical modelling of precipitation variations in Iran. J Civil Environ Eng 2016; 6: 2. [http://dx.doi.org/10.4172/2165-784X.1000230] |
| [59] | Duhan D, Pandey A. Statistical analysis of long term spatial and temporal trends of precipitation during 1901-2002 at Madhya Pradesh, India. Atmos Res 2013; 122: 136-49. [http://dx.doi.org/10.1016/j.atmosres.2012.10.010] |
| [60] | Luković J, Blagojevć D, Kilibarda M, Bajat B. Spatial pattern of north atlantic oscillation impact on rainfall in serbia. Spatial Stat 2015; 14: 39-52. [http://dx.doi.org/10.1016/j.spasta.2015.04.007] |
| [61] | Powell EJ, Keim BD. Trends in Daily Temperature and Precipitation Extremes for the Southeastern United States: 1948-2012. J Clim 2014; 28: 1592-612. [http://dx.doi.org/10.1175/JCLI-D-14-00410.1] |
| [62] | Srinivasan R, Jambulingam P, Kumar NP, Selvakumar M, Edwin B, Kumar TD. Temporal distribution and behaviour of sand flies (Diptera: Psychodidae) in a cutaneous leishmaniasis focus of the Kani Tribe settlements in the Western Ghats, India. Acta Trop 2015; 148: 147-55. [http://dx.doi.org/10.1016/j.actatropica.2015.04.015] [PMID: 25917713] |
| [63] | Dingman SL. Physical hydrology. USA: Waveland press 2015. |
| [64] | Javari M. Climate changes of temperature and precipitation in Iran: PhD Thesis. Tehran University; 2001. |
| [65] | Livada I, Asimakopoulos D. Individual seasonality index of rainfall regimes in Greece. Clim Res 2005; 28: 155-61. [http://dx.doi.org/10.3354/cr028155] |