- Home
- About Journals
-
Information for Authors/ReviewersEditorial Policies
Publication Fee
Publication Cycle - Process Flowchart
Online Manuscript Submission and Tracking System
Publishing Ethics and Rectitude
Authorship
Author Benefits
Reviewer Guidelines
Guest Editor Guidelines
Peer Review Workflow
Quick Track Option
Copyediting Services
Bentham Open Membership
Bentham Open Advisory Board
Archiving Policies
Fabricating and Stating False Information
Post Publication Discussions and Corrections
Editorial Management
Advertise With Us
Funding Agencies
Rate List
Kudos
General FAQs
Special Fee Waivers and Discounts
- Contact
- Help
- About Us
- Search


The Open Atmospheric Science Journal
(Discontinued)
ISSN: 1874-2823 ― Volume 14, 2020
A Study of the Surface Air Temperature Variations in Nigeria
Najib Yusuf1, Daniel Okoh1, *, Ibrahim Musa1, Samson Adedoja1, Rabia Said2
Abstract
Background:
Simultaneous measurements of air temperature were carried out using automatic weather stations at 14 tropical locations in Nigeria. Diurnal variations were derived from the 5-minute update cycle initial data for the years ranging between 2007 and 2013. The temperature trends in Nigeria revealed a continuous variability that is seasonally dependent within any particular year considered.
Method:
The analysis was carried out using available data from the network and the results are presented with a focus to characterize the temperature variations at different locations in the country using the mean, maximum and minimum temperatures from the north which is arid in nature to the south, which is a tropical monsoon climate type and a coastal region.
Result:
In overall, temperature variations in Nigeria were observed to have higher values in the far north, attributed to the influence of Sahara Desert, which has less cloud cover and therefore is more transparent to solar irradiance and lowers values in the south, where there are more cloud cover and abundant vegetation.
Conclusion:
Measured maximum and minimum temperatures in Nigeria are respectively 43.1°C at Yola (north-east part of Nigeria) and 10.2°C for Jos (north-central part of Nigeria). The least temperature variations were recorded for stations in the southern part of the country, while the largest variations were recorded in the north-central region of the country.
Article Information

Identifiers and Pagination:
Year: 2017Volume: 11
First Page: 54
Last Page: 70
Publisher Id: TOASCJ-11-54
DOI: 10.2174/1874282301711010054
Article History:
Received Date: 13/12/2016Revision Received Date: 16/02/2017
Acceptance Date: 10/03/2017
Electronic publication date: 30/06/2017
Collection year: 2017
open-access license: This is an open access article distributed under the terms of the Creative Commons Attribution 4.0 International Public License (CC-BY 4.0), a copy of which is available at: https://creativecommons.org/licenses/by/4.0/legalcode. This license permits unrestricted use, distribution, and reproduction in any medium, provided the original author and source are credited.
* Address correspondence to this author at the Center for Atmospheric Research, Antigba, Kogi State, Nigeria; Tel: +2348136094616; E-mails: okodan2003@gmail.com, okodan2003@yahoo.com
| Open Peer Review Details | |||
|---|---|---|---|
| Manuscript submitted on 13-12-2016 |
Original Manuscript | A Study of the Surface Air Temperature Variations in Nigeria | |
1. INTRODUCTION
Temperature variations play a major role in climate variability, as such the need to continue to monitor the trends of temperature even in locations where temperature pattern has been established is necessary. Climate Change has been a focus of research due to the fact that the consequences of the impact of Climate Change affect human activities and the natural environment significantly, resulting in havoc all over the world [1Oyewole CI. Climate Change: Mitigating Effects of Climate Change by Evolving Sustainable Agricultural System in Nigeria. Int J Sci 2015; 4(6), 2Zoellick RB. A Climate Smart Future, The Nation Newspapers. Lagos, Nigeria: Vintage Press Limited 2009; p. 18.].
The temperature trends vary on a global scale, from the usually cold weather condition at Arctic region to the usually warmer conditions at the Tropics.
In addition, these trends are seasonally dependent [3IPCC Climate Change 2014: Impacts, Adaptation and Vulnerability PART A Global and Sectoral Aspects, Contribution of Working Group II to the Fifth Assessment Report of the Intergovernmental Panel on Climate Change 2014.]. Changes in temperature trends influence Global Warming. According to the Intergovernmental Panel on Climate Change (IPCC), the Green House Gas (GHG) emission is the main cause of Global Warming and the repercussion of the Global Warming/temperature rise would be on the increase for a long period, as long as the GHG emission is not brought under control [4United States Environmental Protection Agency (US EPA) Weather and Climate 2014. Available at: http://www3.epa.gov/climatechange/science/indicators/weather-climate/].
Global Warming is a gradual increase in Earth’s temperatures. The U.S National Research Council [5Surface Temperature Reconstructions for the Last 2,000 Years, Committee on Surface Temperature Reconstructions for the Last 2,000 Years, Board on Atmospheric Sciences and Climate Division on Earth And Life Studies. Washington, D.C.: The National Academies Press 2006.] reported that the Earth planet reached the hottest level that it has never seen in the last 400 years, and possibly even the last 2,000 years.
Studies have shown that the mean global surface temperature has increased by approximately 0.3-0.6°C over the decades prior to the last one [6Lau KM, Weng H. Interannual, Decadal–Interdecadal, and Global Warming Signals in Sea Surface Temperature during 1955–97 Am Meteorol Soc 1999., 7Stanford Solar Centre Sun on Earth 2008. Available at: http://solar-center.stanford.edu/sun-on-earth/glob-warm.html.]. This is the largest increase recorded in surface temperatures in the last 1,000 years and scientists predict an even greater increase over this century. This warming of the globe is largely attributed to the increase of greenhouse gases in the Earth's atmosphere mainly caused by human burning of fossil fuels, industrial, farming, and deforestation activities [8Douglas VH, Kenneth S. The Role of the Sun in Climate Change 1997. Available at: http://solar-center.stanford.edu/sun-on-earth/glob-warm.html].However, solar activity also contributes a certain percentage to global temperature rise [9Friis-Christensen E, Lassen K. Length of the solar cycle: an indicator of solar activity closely associated with climate. Science 1991; 254(5032): 698-700.
[http://dx.doi.org/10.1126/science.254.5032.698] [PMID: 17774798] ].
It is obvious that the rate of Climate Change is different among regions [3IPCC Climate Change 2014: Impacts, Adaptation and Vulnerability PART A Global and Sectoral Aspects, Contribution of Working Group II to the Fifth Assessment Report of the Intergovernmental Panel on Climate Change 2014.]. This difference is caused by different category of land surfaces with varied albedo, evapotranspiration and carbon cycle affecting the climate in different ways [10Meissner K, Weaver A, Matthews H, Cox P. The role of land surface dynamics in glacial inception: a study with the UVic earth system model. Clim Dyn 2003; 21: 515-37.
[http://dx.doi.org/10.1007/s00382-003-0352-2] , 11Snyder PK, Delire C, Foley JA. Evaluating the influence of different vegetation biomes on the global climate. Clim Dyn 2004; 23: 279-302.
[http://dx.doi.org/10.1007/s00382-004-0430-0] ]. Several works have been carried out on climate systems all over the world. For instance in Europe, reference [12Turkes M, Utku MS, Ismail D. Re-evaluation of trends and changes in mean, maximum and minimum temperatures of Turkey for the period 1929–1999. Int J Climatol 2002; 22: 947-77.
[http://dx.doi.org/10.1002/joc.777] ] evaluated mean, maximum and minimum air temperature data in Turkey during the period 1929–1999. Their results revealed spatio-temporal patterns of long-term trends of temperature, change points, and significant warming and cooling periods. The United States Environmental Protection Agency (USEPA) reported an increase in level of warming over the last 30 years [4United States Environmental Protection Agency (US EPA) Weather and Climate 2014. Available at: http://www3.epa.gov/climatechange/science/indicators/weather-climate/]. Average global temperatures show a similar trend, and the top 10 warmest years on record worldwide have all occurred since 1998. Within the United States, temperatures in parts of the North, the West, and Alaska have increased the most [13NOAA, National Centers for Environmental Information, State of the Climate: Global Analysis for Annual 2014 2015. Available at: http://www.ncdc.noaa.gov/sotc/global/201413].
In Central Asia, it was observed that the region’s average near-surface air temperature rose by 1°C – 2°C during the twentieth century [14Houghton JT, Ding Y, Griggs DJ, et al. Climate Change 2001: The Scientific Basis. Cambridge University Press 2001.-17Lioubimtseva E, Henebry GM. Climate and Environmental Change in Arid Central Asia: Impacts, vulnerability, and adaptations. J Arid Environ 2009; 73: 963-77.
[http://dx.doi.org/10.1016/j.jaridenv.2009.04.022] ]. Reference [18Karl TR, Jones PD, Knight RW, et al. Asymmetric trends of daily maximum and minimum temperature: empirical evidence and possible causes. Bull Am Meteorol Soc 1993; 74: 1007-23.
[http://dx.doi.org/10.1175/1520-0477(1993)074<1007:ANPORG>2.0.CO;2] ] analysed temperature data from 37% of global land mass and found high increment in the minimum compared to the maximum temperature. Overall, year 2014 was the warmest year across global land and ocean surfaces since records began in 1880. The annually-averaged temperature was 0.69°C above the 20th century average of 13.9°C, easily breaking the previous records of 2005 and 2010 by 0.04°C [19NASA Determines 2014 as the Warmest Year in Modern Record 2015. Available at: http://www.nasa.gov/press/2015/january/nasa-determines-2014-warmest-year-in-modern-record/].
In Nigeria, according to the year 2012 Nigeria Climate Review, maximum temperatures during the hot season (February - March in the south and March – April in the north) showed that the temperatures ranged between 30.1 and 40.0°C. The maximum temperature gradually increased inland from the coastal areas, with the exception of Jos and its environs [20Nigerian Meteorological Agency (NIMET) In: Annual Climate Review Bulletin. National Weather Forecasting and Climate Research Centre 2012.]. The southeast coastal areas had mean maximum temperatures of 30.0 – 33.0°C, while the coast of the southwest and the inland cities of the south recorded maximum temperatures between 33.0 – 36.0°C. Maximum temperatures over the north central parts ranged between 36.0° - 38.0°C during the period except for Jos and its environs which had mean maximum temperature ranging between 30°-36°C. Jos recorded the lowest maximum temperature of 30.1°C. In other parts of the north, maximum temperatures were between 38.0° - 40.0°C [20Nigerian Meteorological Agency (NIMET) In: Annual Climate Review Bulletin. National Weather Forecasting and Climate Research Centre 2012.].
However, the seasonal northward and southward oscillatory movement of the Inter-Tropical Discontinuity (ITD) largely dictates the weather pattern of Nigeria [21Ojo JS. Rain Height Statistics Based on Degree Celsius Isotherm Height Using TRMM Precipitation Data for Earth-Space Satellite Links in Nigeria. NIMET Climate Review Bulletin 2012.]. The moist south-westerly winds from the South Atlantic Ocean prevail over the country during the rainy season (April – October). On the other side, north-easterly winds, which rise and transport dust particles from the Sahara Desert prevail from the north to the south part of Nigeria during the harmattan period (November – March). The overall changes in temperature and other meteorological variables determined the changes in climate in Nigeria [21Ojo JS. Rain Height Statistics Based on Degree Celsius Isotherm Height Using TRMM Precipitation Data for Earth-Space Satellite Links in Nigeria. NIMET Climate Review Bulletin 2012.].
In this work, we investigated the temperature trend in Nigeria using a network of ground based Automatic Weather Stations (AWS) installed at different locations in Nigeria. Real-time data from the same equipment are strictly applied in spite of some missing data, which occurred either due to power failure or sensor malfunction. However, there is plan in the subsequent work to model the data spatially and temporally using computer Neural Networks. The concern in this present work is strictly to use real time ground-based measurements from equipment installed at each location on the network; while the main purpose of the paper is to categorize the minima, maxima and mean temperatures in the selected locations and also to present the results for tropical climate assessment, environmental study and applications in different fields such as agriculture but not limited to, especially now that Nigeria is focussed on restoring seasonal farming activities as it is undergoing an economic recession due to the drop in price of crude oil in the global market.
2. DATA
The location of Nigeria is within the geographical latitudes 4°N - 14°N and longitudes 2°E - 15°E respectively. Nigeria occupies a total area of 923,768 square kilometers. The country is located between the Equator and the Tropic of Cancer. The latitude of Nigeria falls within the tropical zone, though the climatic conditions are not completely tropical. The climatic condition of Nigeria varies from the northern part to the southern part. The nature of climate condition in the northern part is arid and that of the southern part is an equatorial climate.
The data employed in this work is meteorological surface temperature data in degree Celsius, at five minutes update cycle, from 14 different stations/locations in Nigeria as shown in (Fig. 1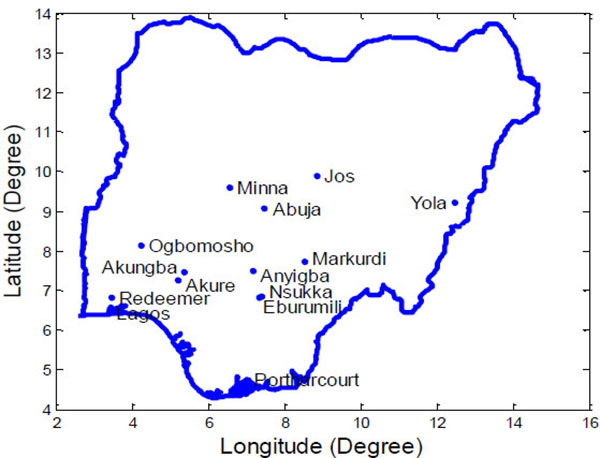 ). This data archive has been a source of meteorological data well published in this region (see references [22Hanson EA, Ayantunji BG, Najib Y, Iloanusi NL, Okeke FN. Empirical Formula for Solar Irradiance, Soil and Air Temperatures Variations in Nsukka, South Eastern Nigeria, using NECOP Data. Nigerian Journal of Space Research 2011; 10: 131-40.-26Okoh D, Najib Y, Adedoja O, Ibrahim MA, Babatunde R. Preliminary Results of Temperature Modeling in Nigeria using Neural Networks, Am. Meteorol Soc Weather 2015; 70(12): 336-43.]). The data was obtained from a network of AWS under the Tropospheric Data Acquisition Network (TRODAN) project of the Centre for Atmospheric Research (CAR), National Space Research and Development Agency, Nigeria (Table 1).
The standard station is a fully configured, solar powered, automated weather station. It consists of a weather-proof enclosure which contains a highly reliable Campbell scientific data logger, barometric pressure sensor, 12V battery and charge controller.
The weather station is equipped with a standard set of sensors which takes records of air temperature, relative humidity, barometric pressure, wind speed and direction, solar radiation, rain rate, soil temperature and moisture.
The data logger is programmed using CR basic for the sensors supplied and when completely connected, the weather station will automatically start to take measurements through each of the parameter sensors outside of the box. It is designed for long term unmanned or unattended operation and is ideal for meteorological, weather monitoring and climate study applications.
 |
Fig. (1) Map of Nigeria showing the Station Locations. |
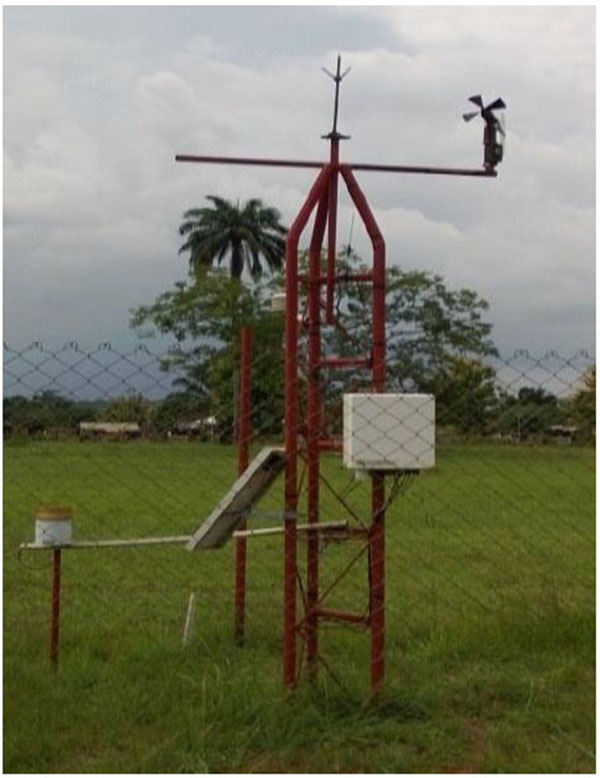 |
Fig. (2) Typical AWS. Anyigba. |
 |
Fig. (3) HMP 50 Probes. (Sensor for Temperature). |
The CR1000 datalogger type is used for measurement and data storage in this station at five-minute update cycle. Different choices of communication options are available which include GSM and GPRS, fixed line phone, phone modem, and direct RS232 connection.
3. METHOD AND RESULTS
Measurements obtained from the network were in 5-minute temporal resolution. The hourly mean temperatures were computed for each location to reduce the data and to obtain smoother profiles. The results are graphically presented in Figs. (4 to 17
to 17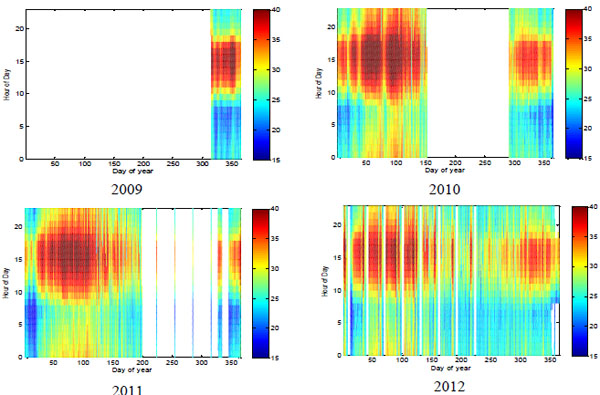 ). The day to year numbers are in the x-axis and hours of the day on the y-axis. The temperature in degree Celsius scale is depicted in colours ranging from 15-40 degrees respectively.
Table 2 shows the maximum and minimum values of the hourly temperatures recorded at the various stations.
 |
Fig. (4) Surface temperature variation at Abuja. |
4. DISCUSSION
Fig. (4) presents the temperature trend in Abuja for the years 2008 to 2011. In spite of the missing data, the temperature trend generally shows a low temperature variation in the morning hours, little increase towards noon and maximum increase at noon. These occurred through the years in view with the exception of January to March where a slight increase in temperature is observed in the morning hours; this is because these months fall within the dry season. In the dry season, tropical continental airmass (CT) blows from the northern Sahara Desert into Nigeria through the northern part and continue to move towards the north-central to the southern part of the country; this is a major natural source that contributes to changes in weather and affects meteorological variables including temperature in Nigeria [20Nigerian Meteorological Agency (NIMET) In: Annual Climate Review Bulletin. National Weather Forecasting and Climate Research Centre 2012.]. The maximum and minimum temperatures of 42.1°C and 14.2°C were observed in Abuja. This high temperature is attributed to the impact of CT coupled with the influence of deforestation. Overall Nigeria is suffering from anthropogenic emissions mainly from oil and gas exploration, traffics and biogenic emissions over forests. These, among other factors, lead to the release of greenhouse gases which contribute to temperature increases over the region. Unfortunately, there is no active emission control available [27Liousse C, Assamoi E, Criqui P, Granier C, Rosset R. Explosive growth in African combustion emissions from 2005 to 2030, Environ Res Lett. 2014.]. More stringent emission control in the future will have a significant impact on temperature trend in Nigeria.
Fig. (5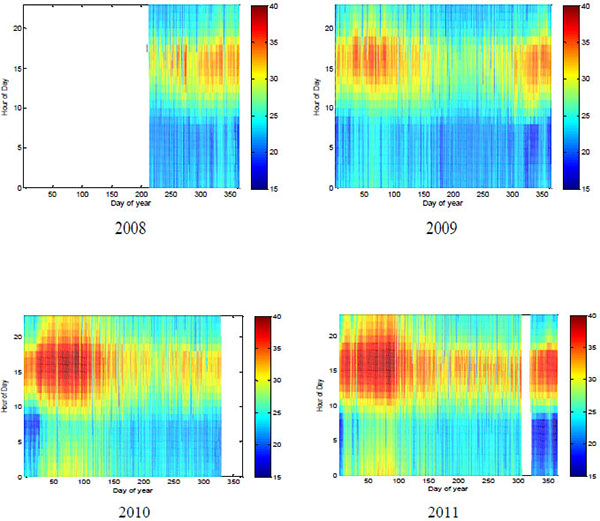 ) presents the temperature trend in Akungba for the years 2008 to 2011. Here the temperature trend observed shows little bit lower temperatures compared to Abuja. Temperatures less than 25°C were observed in the early morning and late evening hours throughout the year with the exceptions of slightly higher temperatures recorded in the early morning hours in the months of December to early March that make up the dry season. It is clear from the Figures that temperature decrease coincides with the rainy season (May to October) and the increase coincides with the dry season (November to April). The maximum and minimum temperatures in Akungba are 37.2°C and 15.9°C, respectively. The range of temperatures in Akungba is generally lower than in Abuja. However, the seasons in Nigeria are distinctively categorised into rainy and dry seasons due to the fact that Nigeria’s climate is tropical in nature. Furthermore, the seasons in Nigeria are controlled by the impact of the trade winds known as the tropical continental airmass and the tropical maritime airmass.
 |
Fig. (5) Surface temperature variation at Akungba. |
Fig. (6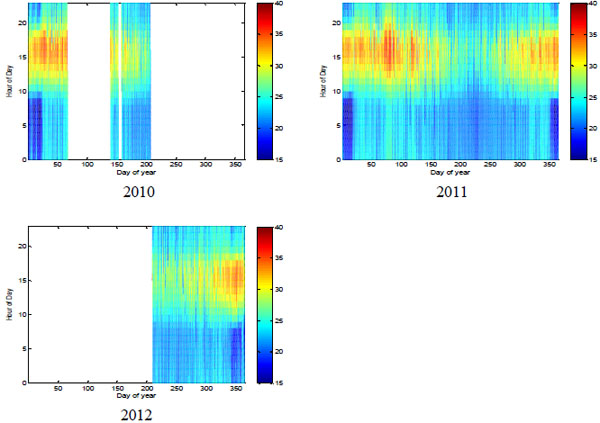 ) shows the temperature trends in Akure for the years 2010 to 2012. In Akure within the years considered in this work, temperatures were generally less than 36°C throughout the season and less than 25°C in the morning hours from around February through to November, and even lower than 20°C during the last days of the years. The maximum and minimum recorded temperatures were 35.7°C and 14.7°C, respectively.
 |
Fig. (6) Surface temperature variation at Akure. |
Figs. (7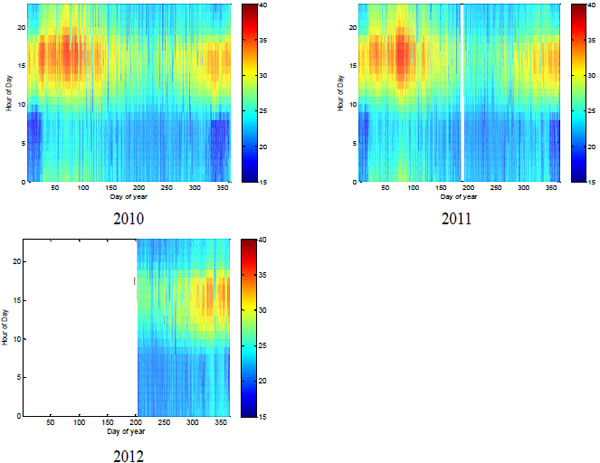 to 10
to 10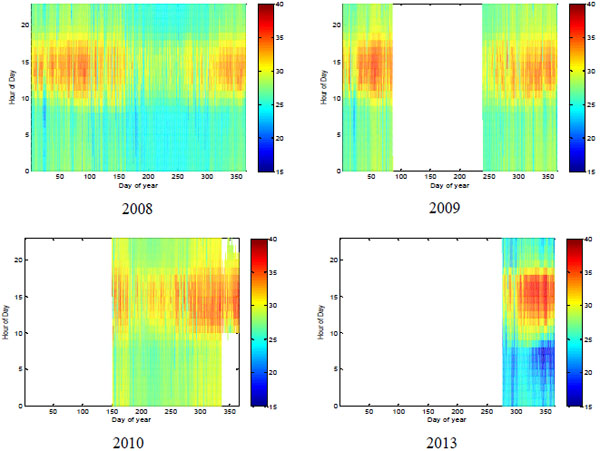 ) depict the temperature trends of Anyigba, Eburimili, Jos and Lagos within the years of data considered in each location in this work. The trend varies generally from lowest temperature in the early morning hours of rainy seasons to lower temperatures at same hours in the dry season. The observed result shows the maximum and minimum temperatures of 36.7°C and 17.0°C, 39.8°C and 16.4°C, 36.3°C and 10.2°C, and 38.3°C and 20.2°C respectively, for the four stations. Temperatures in Jos are the coolest, an attribute of high altitude location.
 |
Fig. (7) Surface temperature variation at Anyigba. |
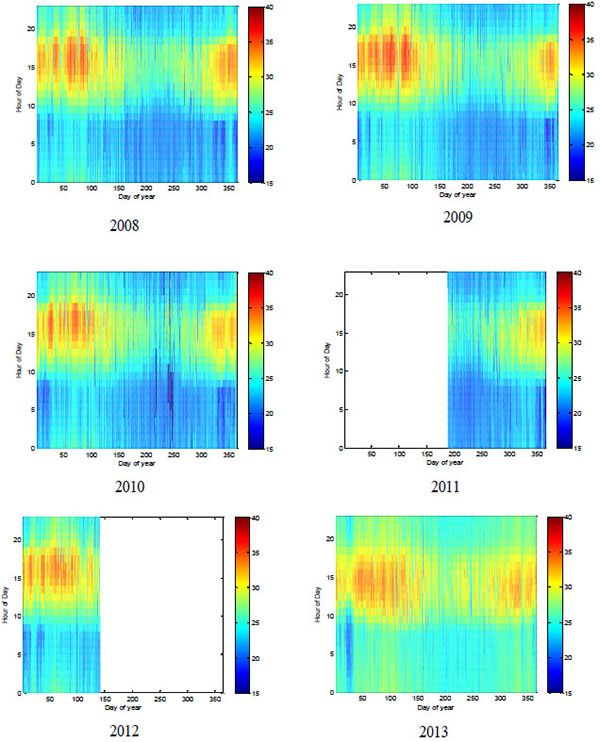 |
Fig. (8) Surface temperature variation at Ebirumili. |
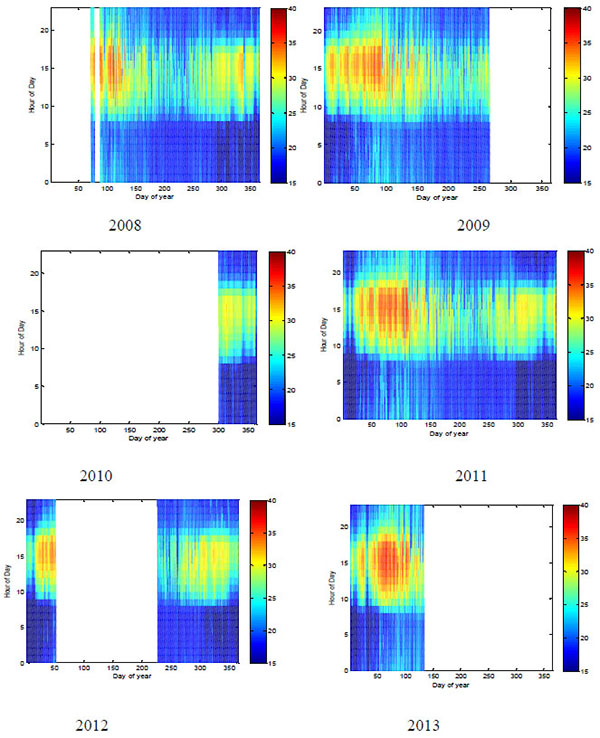 |
Fig. (9) Surface temperature variation at Jos. |
 |
Fig. (10) Surface temperature variation at Lagos. |
Figs. (11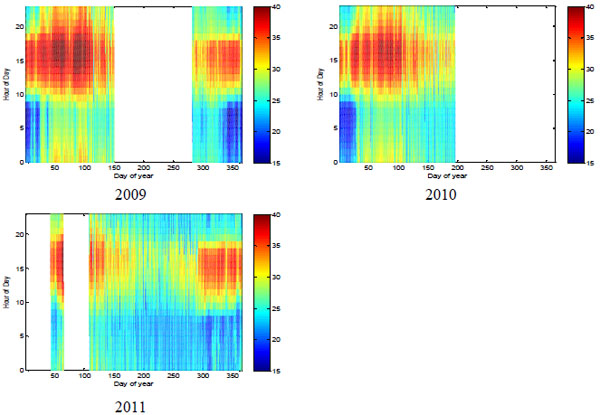 to 13
to 13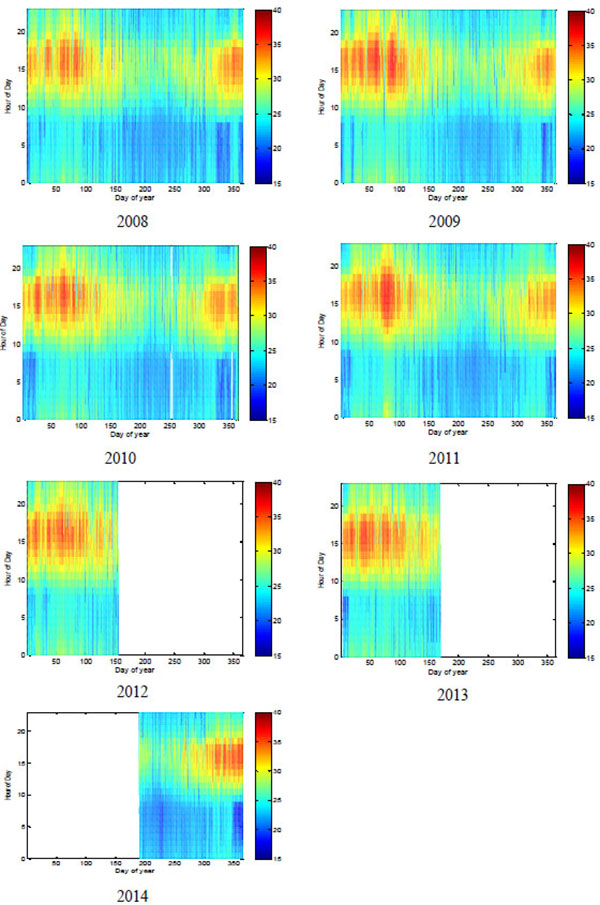 ) show the temperature trends within the years considered in this work for Makurdi, Minna and Nsukka. As can be seen from Fig. (13), years 2008, 2009, 2010 and 2011 have similar trends. The early mornings have temperatures of about 25°C with occasional drops to about 20°C towards the end of the year. In these years, the temperatures rise steadily and sometimes reach a peak of about 35°C especially in the dry season, which is from December to March. It is clear from Fig. (13) that the lower temperatures recorded in the afternoon coincide with the rainy season, which last from May to November in this part of the country. Missing data are observed in the years 2012, 2013 and 2014. However, the available data shows a pattern that conforms to the trend observed in the earlier years of 2008, 2009 and 2011.
 |
Fig. (11) Surface temperature variation at Makurdi. |
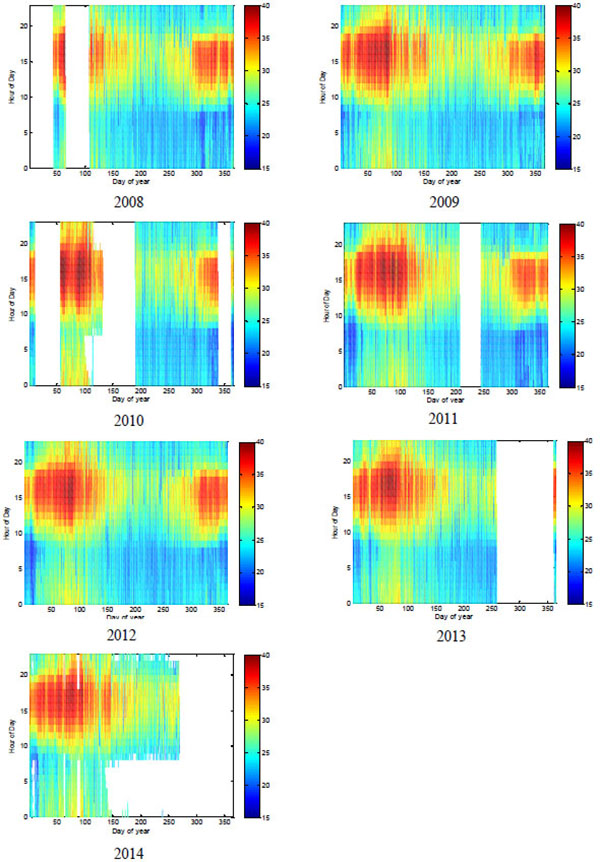 |
Fig. (12) Surface Temperature Variations at Minna. |
 |
Fig. (13) Surface temperature variation at Nsukka. |
The maximum and minimum temperatures observed in these locations are 41.3°C and 14.6°C (Makurdi), 41.2°C and 17.9°C (Minna), 37.4°C and 17.9°C (Nsukka) respectively. In summary, Makurdi recorded the highest and lowest temperatures followed by Minna, indicating a wide range of temperatures for the locations. Both locations are in the northern part of Nigeria, and are respectively located close to the largest inland water bodies within the country; River Benue and River Niger. The fact that water has a high absorption coefficient and therefore absorbs a lot of the infrared radiation emitted from the Earth’s surface refers it as contributing immensely to the high temperatures recorded in riverside areas.
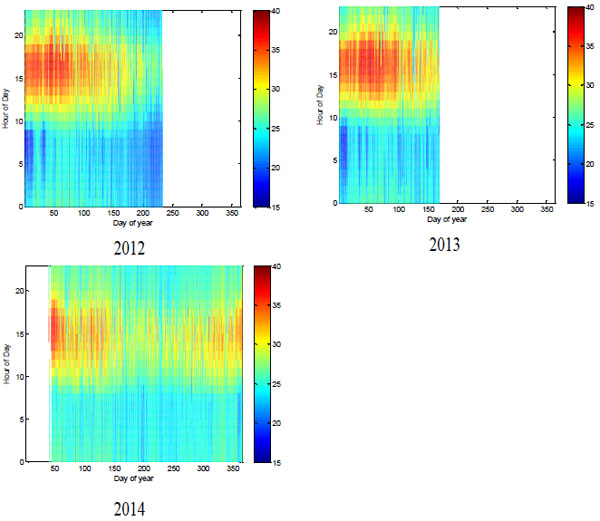 |
Fig. (14) Surface temperature variation at Ogbomosho. |
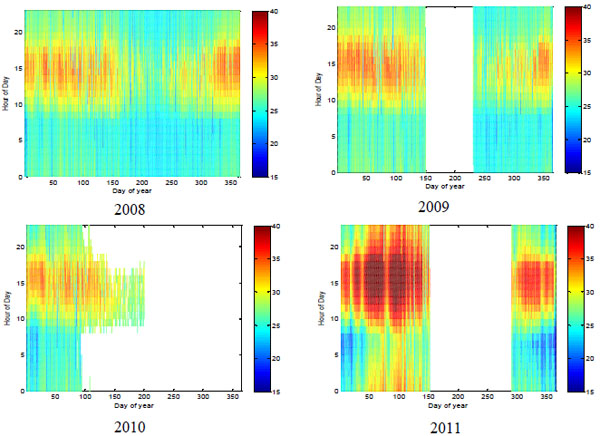 |
Fig. (15) Surface temperature variation at Portharcourt. |
Figs. (14 to 16
to 16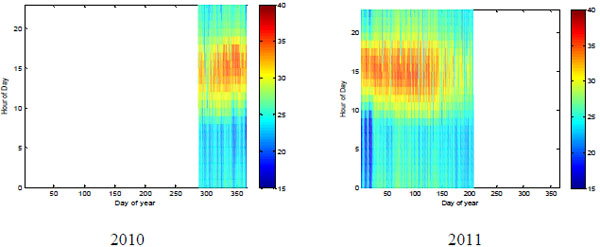 ) present the temperature trends in Ogbomosho, Porthacourt and Redeemers within the years considered in this work. These are locations in coastal regions and they show similar temperature patterns. Lagos also shows a similar temperature pattern. The minimum and maximum temperatures recorded for Portharcourt are respectively 20.2°C and 36.7°C throughout the years considered. For Ogbomosho and Redeemers, the maximum and minimum recorded temperatures are 38.1°C and 17.1°C, and 35.9°C and 17.0°C, respectively.
 |
Fig. (16) Surface Temperature Variations at Redeemers. |
For more clarity, the southern part of Nigeria has tropical rainforest climate characteristics while the central Nigeria has tropical savannah climate characteristics. Also, in the northern part the predominant climate is Sahel Climate.
Fig. (17) presents Yola temperature trends; this is located in the North-Eastern part of the country, Yola recorded the highest temperature of 43.1°C within the locations considered in this work. Yola is at the border where it is open to direct influence of the tropical continental airmass from the Sahara desert.
 |
Fig. (17) Surface temperature variation at Yola. |
Overall, the temperature trends in Nigeria presented in Figs. (4 to 17) show a continuous variability which is seasonally dependent within any particular year. The variations were observed to have higher values in the north, which is arid in nature and low values in the south which is equatorial monsoon climate area and a coastal region. Fig. (18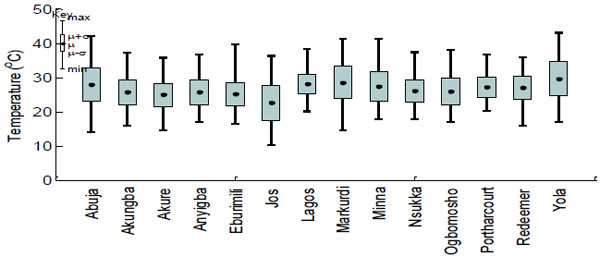 ) shows that Jos station records the lowest temperatures. The temperature variation is however large for the station. Lagos records the least temperature variations; this is as a result of the direct influence of the temperature moderating monsoon originating from the South Atlantic Ocean, resulting in abundant rainfall and consequentially lowering the temperature.
 |
Fig. (18) Maximum and minimum temperature at different stations. |
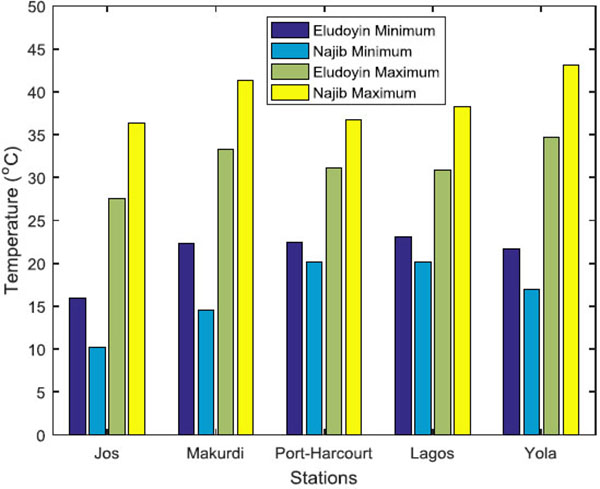 |
Fig. (19) A comparison of extreme temperatures in this work with those of Reference [29]. In the key, Eludoyin Minimum and Eludoyin Maximum respectively represent monthly means of the minimum and maximum temperatures as observed in Reference [29] while Najib Minimum and Najib Maximum respectively represent minimum and maximum temperatures as observed in this work. |
CONCLUSION
An overview of surface air temperature measurements from equipment in the TRODAN network was presented to characterize the surface temperature variations across Nigeria. The results reveal a continuous variability that is seasonally dependent in each of the years.
Maximum and minimum values are respectively 43.1°C at Yola (north-east Nigeria) and 10.2°C at Jos (north-central Nigeria). The maximum temperature 43.1°C observed at Yola in this work shows an increase of 3.1°C when compared to the NIMET’s Climate report of 2012 which states a maximum temperature of 40.0°C. This temperature increase is connected to the global climate change.
In general, the temperatures were observed to be higher in the northern parts of the country. This was explained to be consequence of the nearby Sahara Desert, which has less cloud cover and is therefore more exposed to solar irradiance. The southern part of the country was characterized by relatively lower temperatures; the region has more cloud cover and abundant vegetation [28Falayi EO, Rabiu AB. Estimation of global solar radiation using cloud cover and surface temperature in some selected cities in Nigeria. Arch Phy Res 2011; 2(3): 99-109.]. The least temperature variations were also recorded for stations in the southern part of the country, while the largest variations were recorded in the north-central region of the country.
ETHICS APPROVAL AND CONSENT TO PARTICIPATE
Not applicable.
HUMAN AND ANIMAL RIGHTS
No Animals/Humans were used for studies that are base of this research.
CONSENT FOR PUBLICATION
Not applicable.
CONFLICT OF INTEREST
The authors confirm that this article content has no conflict of interest.
ACKNOWLEDGEMENTS
We appreciate the Tropospheric Data Acquisition Network (TRODAN) project of the Centre for Atmospheric Research for providing temperature data used in this paper.
REFERENCES
| [1] | Oyewole CI. Climate Change: Mitigating Effects of Climate Change by Evolving Sustainable Agricultural System in Nigeria. Int J Sci 2015; 4(6) |
| [2] | Zoellick RB. A Climate Smart Future, The Nation Newspapers. Lagos, Nigeria: Vintage Press Limited 2009; p. 18. |
| [3] | IPCC Climate Change 2014: Impacts, Adaptation and Vulnerability PART A Global and Sectoral Aspects, Contribution of Working Group II to the Fifth Assessment Report of the Intergovernmental Panel on Climate Change 2014. |
| [4] | United States Environmental Protection Agency (US EPA) Weather and Climate 2014. Available at: http://www3.epa.gov/climatechange/science/indicators/weather-climate/ |
| [5] | Surface Temperature Reconstructions for the Last 2,000 Years, Committee on Surface Temperature Reconstructions for the Last 2,000 Years, Board on Atmospheric Sciences and Climate Division on Earth And Life Studies. Washington, D.C.: The National Academies Press 2006. |
| [6] | Lau KM, Weng H. Interannual, Decadal–Interdecadal, and Global Warming Signals in Sea Surface Temperature during 1955–97 Am Meteorol Soc 1999. |
| [7] | Stanford Solar Centre Sun on Earth 2008. Available at: http://solar-center.stanford.edu/sun-on-earth/glob-warm.html. |
| [8] | Douglas VH, Kenneth S. The Role of the Sun in Climate Change 1997. Available at: http://solar-center.stanford.edu/sun-on-earth/glob-warm.html |
| [9] | Friis-Christensen E, Lassen K. Length of the solar cycle: an indicator of solar activity closely associated with climate. Science 1991; 254(5032): 698-700. [http://dx.doi.org/10.1126/science.254.5032.698] [PMID: 17774798] |
| [10] | Meissner K, Weaver A, Matthews H, Cox P. The role of land surface dynamics in glacial inception: a study with the UVic earth system model. Clim Dyn 2003; 21: 515-37. [http://dx.doi.org/10.1007/s00382-003-0352-2] |
| [11] | Snyder PK, Delire C, Foley JA. Evaluating the influence of different vegetation biomes on the global climate. Clim Dyn 2004; 23: 279-302. [http://dx.doi.org/10.1007/s00382-004-0430-0] |
| [12] | Turkes M, Utku MS, Ismail D. Re-evaluation of trends and changes in mean, maximum and minimum temperatures of Turkey for the period 1929–1999. Int J Climatol 2002; 22: 947-77. [http://dx.doi.org/10.1002/joc.777] |
| [13] | NOAA, National Centers for Environmental Information, State of the Climate: Global Analysis for Annual 2014 2015. Available at: http://www.ncdc.noaa.gov/sotc/global/201413 |
| [14] | Houghton JT, Ding Y, Griggs DJ, et al. Climate Change 2001: The Scientific Basis. Cambridge University Press 2001. |
| [15] | Lioubimtseva ER, Cole JM, Kapustin G. Impacts of Climate and Land-cover changes in Arid Lands of Central Asia. J Arid Environ 2005; 62: 285-308. [http://dx.doi.org/10.1016/j.jaridenv.2004.11.005] |
| [16] | Lioubimtseva E, Cole R. Uncertainties of climate change in arid environments of central Asia. Rev Fish Sci 2006; 14: 29-49. [http://dx.doi.org/10.1080/10641260500340603] |
| [17] | Lioubimtseva E, Henebry GM. Climate and Environmental Change in Arid Central Asia: Impacts, vulnerability, and adaptations. J Arid Environ 2009; 73: 963-77. [http://dx.doi.org/10.1016/j.jaridenv.2009.04.022] |
| [18] | Karl TR, Jones PD, Knight RW, et al. Asymmetric trends of daily maximum and minimum temperature: empirical evidence and possible causes. Bull Am Meteorol Soc 1993; 74: 1007-23. [http://dx.doi.org/10.1175/1520-0477(1993)074<1007:ANPORG>2.0.CO;2] |
| [19] | NASA Determines 2014 as the Warmest Year in Modern Record 2015. Available at: http://www.nasa.gov/press/2015/january/nasa-determines-2014-warmest-year-in-modern-record/ |
| [20] | Nigerian Meteorological Agency (NIMET) In: Annual Climate Review Bulletin. National Weather Forecasting and Climate Research Centre 2012. |
| [21] | Ojo JS. Rain Height Statistics Based on Degree Celsius Isotherm Height Using TRMM Precipitation Data for Earth-Space Satellite Links in Nigeria. NIMET Climate Review Bulletin 2012. |
| [22] | Hanson EA, Ayantunji BG, Najib Y, Iloanusi NL, Okeke FN. Empirical Formula for Solar Irradiance, Soil and Air Temperatures Variations in Nsukka, South Eastern Nigeria, using NECOP Data. Nigerian Journal of Space Research 2011; 10: 131-40. |
| [23] | Najib Y, Ekpe OE. Solar Photospheric Index Variability Forcing of Climate Change on Seasonal Scales in Anyigba North-Central Nigeria, Nig. Meteorolo. Soc. Proceedings 2013; pp. 103-6. |
| [24] | Najib Y, Ayantunji BG. Correlation between the Sunspot Number and Tropospheric Surface Refractivity in a Tropical Region. J Atmos Sol Terr Phys 2015; 133: 1-6. [http://dx.doi.org/10.1016/j.jastp.2015.07.012] |
| [25] | Said RS, Gabriel FI, Garba MB, Najib Y. Variation of Solar Radiation and its Correlation with Weather Parameters using Statistical Analysis at Yola, North-Eastern Nigeria. Journal of the Nigerian Association of Mathematical Physics 2015; 29: 319-24. |
| [26] | Okoh D, Najib Y, Adedoja O, Ibrahim MA, Babatunde R. Preliminary Results of Temperature Modeling in Nigeria using Neural Networks, Am. Meteorol Soc Weather 2015; 70(12): 336-43. |
| [27] | Liousse C, Assamoi E, Criqui P, Granier C, Rosset R. Explosive growth in African combustion emissions from 2005 to 2030, Environ Res Lett. 2014. |
| [28] | Falayi EO, Rabiu AB. Estimation of global solar radiation using cloud cover and surface temperature in some selected cities in Nigeria. Arch Phy Res 2011; 2(3): 99-109. |