- Home
- About Journals
-
Information for Authors/ReviewersEditorial Policies
Publication Fee
Publication Cycle - Process Flowchart
Online Manuscript Submission and Tracking System
Publishing Ethics and Rectitude
Authorship
Author Benefits
Reviewer Guidelines
Guest Editor Guidelines
Peer Review Workflow
Quick Track Option
Copyediting Services
Bentham Open Membership
Bentham Open Advisory Board
Archiving Policies
Fabricating and Stating False Information
Post Publication Discussions and Corrections
Editorial Management
Advertise With Us
Funding Agencies
Rate List
Kudos
General FAQs
Special Fee Waivers and Discounts
- Contact
- Help
- About Us
- Search


The Open Atmospheric Science Journal
(Discontinued)
ISSN: 1874-2823 ― Volume 14, 2020
Impact of Energetic Electron Precipitation on the Upper Atmosphere: Nitric Monoxide
A. Vialatte1, *, M. Barthélemy1, J. Lilensten1
Abstract
Background:
Nitric oxide concentration in the upper atmosphere is known to be highly dependent on the solar activity. It can be transported to the stratosphere by the atmospheric circulation. In the stratosphere it is responsible for the destruction of ozone and consequently stratospheric heating rates are affected. This is one of the mechanisms by which solar variability has been suspected to drive variability in the energetic budget of the Earth climate. Therefore, it is essential to know every physical and chemical processes leading to the production or to a destruction of nitric oxide.
Aim:
The aim of this work is to calculate the production rate of NO+ and some of the NO electronic states created by electron impact on NO at night in the auroral zone using an electron transport code.
Conclusion:
We study this variability under different precipitation conditions and taking into account the variability of the neutral atmosphere with the geomagnetic and solar activity. We find that the energetic electron precipitation has a very small effect on the absolute value of the NO+ and NO* production rates. In order to help further research to consider the effect of NO+ and NO*, we provide a table of all the production rates in a medium solar and geomagnetic activity case.
Article Information

Identifiers and Pagination:
Year: 2017Volume: 11
First Page: 88
Last Page: 104
Publisher Id: TOASCJ-11-88
DOI: 10.2174/1874282301711010088
Article History:
Received Date: 20/10/2016Revision Received Date: 07/03/2017
Acceptance Date: 11/03/2017
Electronic publication date: 27/07/2017
Collection year: 2017
open-access license: This is an open access article distributed under the terms of the Creative Commons Attribution 4.0 International Public License (CC-BY 4.0), a copy of which is available at: https://creativecommons.org/licenses/by/4.0/legalcode. This license permits unrestricted use, distribution, and reproduction in any medium, provided the original author and source are credited.
* Address correspondence to this author at the Univ. Grenoble Alpes, CNRS, IPAG, F-38000 Grenoble, France, 414 rue de la Piscine - BP 53 - 38041 Grenoble cedex 9 - France; E-mail: anne.vialatte@univ-grenoble-alpes.fr
| Open Peer Review Details | |||
|---|---|---|---|
| Manuscript submitted on 20-10-2016 |
Original Manuscript | Impact of Energetic Electron Precipitation on the Upper Atmosphere: Nitric Monoxide | |
INTRODUCTION
The IPCC Fifth Assessment Report [1Herzberg G. Climate Change 2014: Synthesis report contribution of working groups I, II and III to the fifth assessment report of the intergovernmental panel on climate change. Geneva: IPCC 2014.] analyses the radiative forcing at Earth1. In this analysis, the positive radiative forcing due to human activity is clearly predominant (2.29 Wm-2 ±1.1 W.m-2). The one due to solar activity is much smaller (about 0.05 W.m-2 ± 0.05 Wm-2) [1Herzberg G. Climate Change 2014: Synthesis report contribution of working groups I, II and III to the fifth assessment report of the intergovernmental panel on climate change. Geneva: IPCC 2014.].
A recent monograph reviews all the possible mechanisms by which the solar activity could impact Earth climate [2Lilensten J, Dudok De Wit T, Matthes K. response to a changing Sun [Sl]: EDPS Ed, 2015. 2015., 3Rozanov EV, Egorova TA, Shapiro AI, Schmutz WK. Modeling of the atmospheric response to a strong decrease of the solar activity. Proceedings of the IAU 2011; 7(S286):215-24.]. Amongst them is the impact of the nitric oxide NO in the upper atmosphere [4Seppälä A, Funke B, Verronen P. Impact of energetic particle precipitation on atmospheric chemistry and climate. In: 2015; pp. LILENSTEN, T D D W K M Earth’s climate response to a changing sun. 2015; pp. 267-72. [S.l.]: EDPS Ed.]. From these authors, NOx are produced in the stratosphere and mesosphere through molecular ionisation of the ambient gas, including the minor NO specie, and subsequent recombination. NOx are known to have lifetime up to several months. The main destruction mechanism is through photo absorption. Therefore, they remain a long time in the atmosphere during the polar night. Then they experience horizontal and vertical transport. The latter likely happens in the polar vortex and may transport
NO produced in the thermosphere down to low atmospheric layers where it destroys the ozone [5Johnston H. Reduction of stratospheric ozone by nitrogen oxide catalysts from supersonic transport exhaust. Science 1971; 173(3996): 517-22.[http://dx.doi.org/10.1126/science.173.3996.517] [PMID: 17738433] ]. NO can also be ionized and excited. The main ionisation source in the polar night is through electron precipitation. Their influence on atmospheric chemistry is reviewed [6Rozanov EV, Calisto M, Egorova TA, Peter T, Schmutz WK. Influence of the precipitating energetic particles on atmospheric chemistry and climate. Surv Geophys 2012; 33: 483-501.
[http://dx.doi.org/10.1007/s10712-012-9192-0] ]. However, the production of excited NO or NO+ in the thermosphere has never been addressed up to now. This is important because NO+ and excited NO can change species reactivity and therefore accelerate or slow down destruction processes. Computing the productions under different electrons precipitations conditions is the aim of this work. It may not have a major impact, but we are hopeful that this analysis will offer new insights for atmospheric modelers.
1. NITRIC MONOXIDE IN THE ATMOSPHERE
At ground, NO and NO2 are mainly produced during the combustion of fossil fuels and are released into the troposphere. However, NO is also produced at much higher altitudes above the stratosphere. The more the solar activity, the more NO is produced with potential effects in Europe and North America [3Rozanov EV, Egorova TA, Shapiro AI, Schmutz WK. Modeling of the atmospheric response to a strong decrease of the solar activity. Proceedings of the IAU 2011; 7(S286):215-24.]. To quantify its effects it is important to know all the mechanisms of production and destruction of NO and of its derivatives NO+ and NO*.
The nitric monoxide density in the thermosphere peaks around 110 km [7Siskind D, Barth C, Russel J. A climatology of nitric oxide in the meso- sphere and thermosphere. Adv Space Res 1998; 1353-62.
[http://dx.doi.org/10.1016/S0273-1177(97)00743-6] ]. It is commonly larger at high latitudes and may exceed 2.1014 molecules per m3 [8Bermejo-Pantaleón D, Funke B, López-Puertas M, et al. Global observations of thermospheric temperature and nitric oxide from MIPAS spectra at 5.3 μm. J Geophys Res Space Physics 2011; 116.
[http://dx.doi.org/10.1029/2011JA016752] ]. The Student Nitric Oxide Explorer (SNOE) satellite provided NO measurements from March 11, 1998 to September 20, 2000. It had a sun-synchronous orbit inclined at 97.7 degrees to the equator and made 15 orbits per day. This allowed an almost global coverage of the Earth's atmosphere between latitudes 82°S and 82°N. SNOE measured the concentration of nitric monoxide between 97 and 150 km. Fig. (1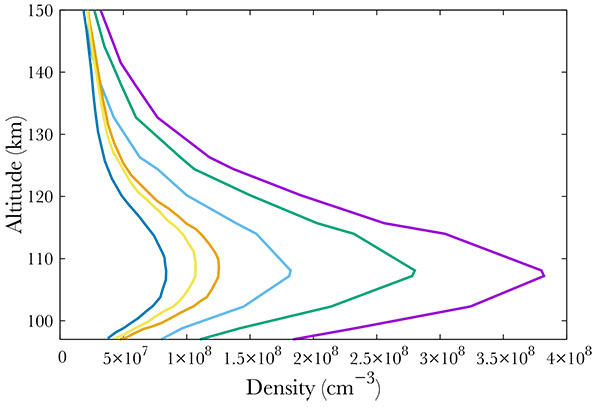 ) shows some of the SNOE measurements at the equator and high latitude, between 60° and 70° for low geomagnetic and solar activity (Ap smaller than 6, f10.7 smaller than 132), medium (Ap from 6 to 12, f10.7 between 132 and 165) and high activity (Ap larger than 12, f10.7 larger than 165). From these data, it is obvious that the NO content is directly linked to the solar and geomagnetic activity.
 |
Fig. (1) Average NO density at the equator for low solar activity (dark blue), medium (gold) and high (orange). Average NO density at high latitudes (60° - 70°) for low geomagnetic activity (light blue), medium (green), and high (purple). From [9Barth C, Mankoff KD, Bailey SM, Solomon SC. Global observations of nitric oxide in the thermosphere. J Geophys Res 2003; 108.]. |
We used SNOE data [9Barth C, Mankoff KD, Bailey SM, Solomon SC. Global observations of nitric oxide in the thermosphere. J Geophys Res 2003; 108.] to build our NO model. As we did not find extensive data for NO concentration above 150 km, we performed a logarithmic extrapolation based on SNOE data. This choice is motivated by the scale height evolution.
1.1. NO Production
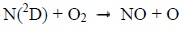
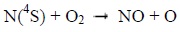
Photons and electrons can dissociate molecular nitrogen thereby producing excited atomic nitrogen. The latter then reacts with molecular oxygen according to the following chemical reactions:
 |
(1) |
 |
(2) |
Below 130 km, the reaction 1 mainly produces NO during the day. It is much less effective at night. Above 130 km, the reaction 2 is the main source of NO during the day, and the main source during the night under 130 km [8Bermejo-Pantaleón D, Funke B, López-Puertas M, et al. Global observations of thermospheric temperature and nitric oxide from MIPAS spectra at 5.3 μm. J Geophys Res Space Physics 2011; 116.
[http://dx.doi.org/10.1029/2011JA016752] ].
There are two sources of NO. The energetic electrons participating in reactions come either from particle precipitations at high latitudes or from the interaction of the solar electromagnetic flux in the soft X-ray with the molecules of the thermosphere, where the effect is maximum in the equatorial region [8Bermejo-Pantaleón D, Funke B, López-Puertas M, et al. Global observations of thermospheric temperature and nitric oxide from MIPAS spectra at 5.3 μm. J Geophys Res Space Physics 2011; 116.
[http://dx.doi.org/10.1029/2011JA016752] -9Barth C, Mankoff KD, Bailey SM, Solomon SC. Global observations of nitric oxide in the thermosphere. J Geophys Res 2003; 108.].
1.2. NO Destruction
NO is mainly destroyed by the photon flux in the extreme ultraviolet which dissociates it according to [9Barth C, Mankoff KD, Bailey SM, Solomon SC. Global observations of nitric oxide in the thermosphere. J Geophys Res 2003; 108.]:
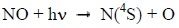 |
(3) |
and by N(4S) through [8Bermejo-Pantaleón D, Funke B, López-Puertas M, et al. Global observations of thermospheric temperature and nitric oxide from MIPAS spectra at 5.3 μm. J Geophys Res Space Physics 2011; 116.
[http://dx.doi.org/10.1029/2011JA016752] ]:
 |
(4) |
Therefore, NO is negligible in the dayside thermosphere. The case is radically different in the polar nightside.
1.3. NO Vertical Transport
The WACCM model (Whole Atmosphere Community Climate Model) combines chemistry and dynamics of the atmosphere from the surface to 140 km altitude. It computes an upward air mass flow in the vicinity of the summer pole, and a downward air mass flow near the winter pole [10Smith AK, Garcia PR, Marsh DR, Richter JH. WACCM simulations of the mean circulation and trace species transport in the winter mesosphere. J Geophys Res (Atmospheres) 2011; 116.
[http://dx.doi.org/10.1029/2011JD016083] ]. Above each tropospheric convection cell, another cell is created, moving in the opposite direction: upward flow around the winter pole and a downward flow around the summer pole. Vertical density gradients of nitric monoxide are created, resulting in a transport of NO to the higher altitudes in summer pole and a downward transport around the winter pole. NO is thus injected into the stratosphere where it can destroy ozone by NO + O3 NO2 + O2 [3Rozanov EV, Egorova TA, Shapiro AI, Schmutz WK. Modeling of the atmospheric response to a strong decrease of the solar activity. Proceedings of the IAU 2011; 7(S286):215-24.] thus contributing to the energy budget of the atmosphere. Indeed, stratospheric ozone O3 filters almost all the solar ultra-violet radiation. In addition, horizontal transport of NO was observed, in particular by [9Barth C, Mankoff KD, Bailey SM, Solomon SC. Global observations of nitric oxide in the thermosphere. J Geophys Res 2003; 108.]. The nitric oxide produced at high latitudes can be transported to lower latitudes but the physical phenomena behind these transports remain poorly known.
One of the major flaws of this scheme is that the reaction rates take no account of the NO electronic states nor of its potential ion NO+, simply because these have not been studied yet. Ionisation and excited states could have a role in NO chemical reactivity and thus the climate. Moreover, the connection between energetic precipitations and climate has already been assessed in review articles [11Seppälä A, Matthes K, Randall CE, Mironova IA. What is the solar influence on climate? Overview of activities during CAWSES-II. Prog. Earth Planet Sci 2014; 1:24.] and [4Seppälä A, Funke B, Verronen P. Impact of energetic particle precipitation on atmospheric chemistry and climate. In: 2015; pp. LILENSTEN, T D D W K M Earth’s climate response to a changing sun. 2015; pp. 267-72. [S.l.]: EDPS Ed.] though both articles state that effects (direct and indirect) persist in the upper atmosphere down to the stratosphere.
2. MODELING
Part of the magnetospheric electrons is driven along the Earth magnetic field lines to end in an oval centered around the magnetic poles. They enter the thermosphere with energies up to a few hundreds of keV. These suprathermal electrons ionize, excite and dissociate the atmospheric atoms and molecules and produce the population of ions and excited species. During these collisions, the electrons gradually lose their energy. The Boltzmann equation describes the evolution of these precipitated electrons during collisions with other particles through the stationary electron flux Φ (in cm-2.s-1.eV-1.sr-1) depending on the altitude z, the electron energy E and pitch angle θ relative to the magnetic field:
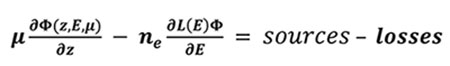 |
(5) |
Where μ is the cosine of the electron pitch angle, ne the thermal electron density, E their energy, and L(E) represents the stopping power cross section which is active in the friction force between ambiant and suprathermal electrons, and is computed under continuous slowing down approximation [12Swartz W, Nisbet J. Revised calculations of F region ambient electron heating by photoelectrons. J Geophys Res 1972; 77]. The losses are characterized by the flow that degrades itself towards lower energies, to other angles and altitudes, when the electrons ionize and excite. The sources are the precipitated electrons and the electrons of higher energies.
Once
 is computed, the production of any state st (excitation, ionisation or dissociation) of a species sp at altitude z writes:
 |
(6) |
Where
 is the collision cross section of the species sp with electrons of energy E to gives state st, and nsp its density.
In the case of nitric monoxide, the electrons can ionize and dissociate into NO+, N+ and O+. NO can also be excited into 22 states, see Table (1). The corresponding cross sections come [13Brunger M, Campbell L, Cartwright DC, Middleton AG, Mojarrabi B, Teubner PGO. Electron-impact excitation of Rydberg and valence electronic states of nitric oxide: II. Integral cross sections. J Phys B 2000; 33: 809-19.
[http://dx.doi.org/10.1088/0953-4075/33/4/315] ] for incident electron energies of 10, 20, 30, 40 and 50 eV, and we performed a logarithmic extrapolation for larger energies.

Electronic states of NO*production by electron impact on NO. The second column stands for the excitation threshold for most the NO electronic states. [13Brunger M, Campbell L, Cartwright DC, Middleton AG, Mojarrabi B, Teubner PGO. Electron-impact excitation of Rydberg and valence electronic states of nitric oxide: II. Integral cross sections. J Phys B 2000; 33: 809-19.
[http://dx.doi.org/10.1088/0953-4075/33/4/315] ]
The TRANSSOLO code uses a multi-stream approach [14Lilensten J, Cander L. Calibration of the TEC derived from GPS measurements and from ionospheric models using the EISCAT radar. J Atmos Sol Terr Phys 2003; 65: 833-42.
[http://dx.doi.org/10.1016/S1364-6826(03)00087-7] -16Lummerzheim D, Rees M, Anderson H. Angular dependent transport of auroral electrons in the upper atmosphere. Planet Space Sci 1989; 109-29.
[http://dx.doi.org/10.1016/0032-0633(89)90074-3] ], which solves the Boltzmann equation for electron transport in the atmosphere. We can then derive the excitation and ionisation rate from the flux intensity and the corresponding cross-sections. The model has been proven valid through laboratory experiment [17Bilitza D, Brown SA, Wang MY, Souza JR, Roddy PA. Measurements and IRI model predictions during the recent solar minimum. J Atmos Sol Terr Phys 2012; 86: 99-106.
[http://dx.doi.org/10.1016/j.jastp.2012.06.010] ] and in-situ observations [18Picone J, Brown SA, Wang MY, Souza JR, Roddy PA. NRLMSISE-00 empirical model of the atmosphere: Statistical comparisons and scientific issues J. Geophys Res Space Physics 2002; 107.-20Culot F, Lathuillère C, Lilensten J, Witasse O. The OI 630.0 and 557.7nm day- glow measured by WINDII and modeled by TRANSCAR. Ann Geophys 2004; 22: 1947-60.
[http://dx.doi.org/10.5194/angeo-22-1947-2004] ] 2.
We also compared our computation with [21Fang X, Randall CE, Lummerzheim D, et al. Electron impact ionization: A new parameterization for 100 eV to 1 MeV electrons. J Geophys Res 2008; 113.] where the authors compute the electron production in different atmospheric cases and with different methods such as the same transport code used here.
We find a similar altitude of deposition but surprisingly a smaller production rate. We could not explain this discrepancy.
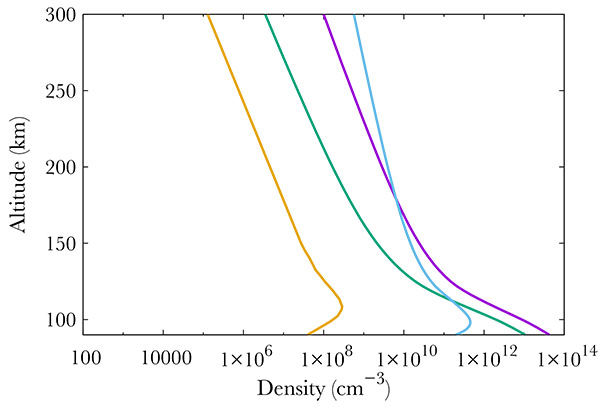 |
Fig. (2) Neutral density profiles at 70°N. At 400 km, one gets from left to right : NO (gold line), O2 (green), N2 (purple) and O (blue). |
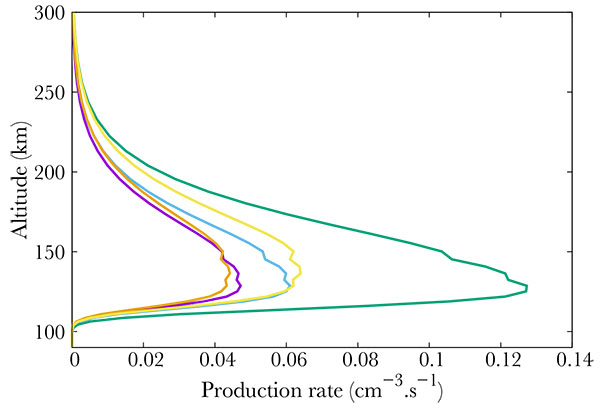 |
Fig. (3) Production (from right to left) of the b4Σ- (green), B'2Δ (gold), L'2Φ (blue), C2Π (purple) and L2Π (orange) electronic states of NO. |
3. RESULTS
Figs. (3 , 4
, 4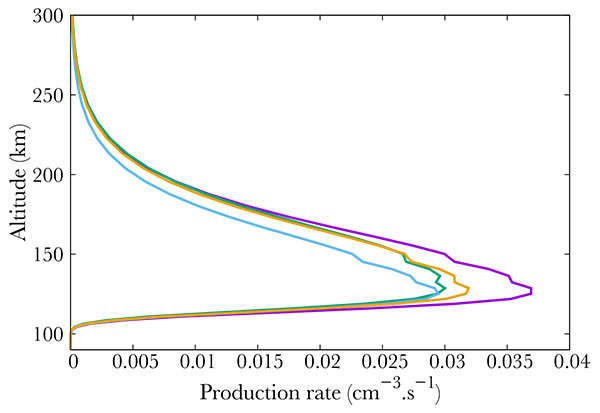 , 5
, 5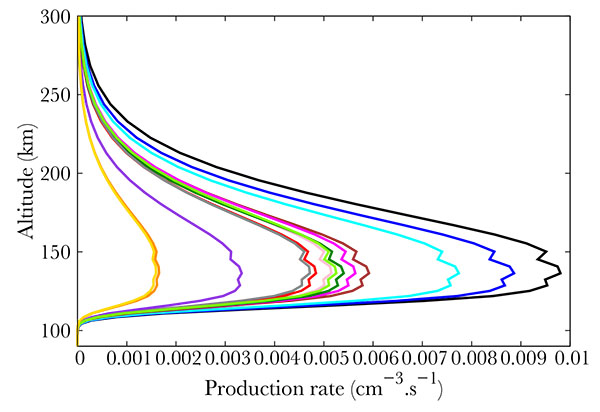 ) show the productions of all the 22 NO excited states in the same thermospheric conditions as in Fig. (2
 ). The total energy of the precipitated electrons is 3.2 erg. cm-2s-1, which corresponds to the energy in a strong aurora [22Hultqvist B. Earth’s magnetosphere [Sl]:. Kluwer Academic Publisher 2002.]. Fig. (3) corresponds to the strongest productions of excited states [23Cartwright D, Brunger MJ, Campbell L, Mojarrabi B, Teubner PJO. Nitric oxide excited under auroral conditions: Excited state densities and band emissions. J Geophys Res 2000. ; 105:20857-67.
[http://dx.doi.org/10.1029/1999JA000333] ]. provide an up to date energy diagram of NO. Comparing our results with this diagram, one concludes that the most excited states are not the lowest ones but are scattered over a large span. Fig. (5) represents the states that are little excited. Logically, they are provided by high energy states (see [23Cartwright D, Brunger MJ, Campbell L, Mojarrabi B, Teubner PJO. Nitric oxide excited under auroral conditions: Excited state densities and band emissions. J Geophys Res 2000. ; 105:20857-67.
[http://dx.doi.org/10.1029/1999JA000333] ]).
Finally, Fig. (4) show middle term excited states, which all correspond to low energy states. The altitude of the maximum remains the same whatever the excitation state, corresponding to the maximum in NO density, i.e. 110 km.
 |
Fig. (4) Production (from right to left) of the A2Σ+ (purple), D2Σ+ (green), a4Π (blue) and B2Π (orange) electronic states of NO. |

Fig. (6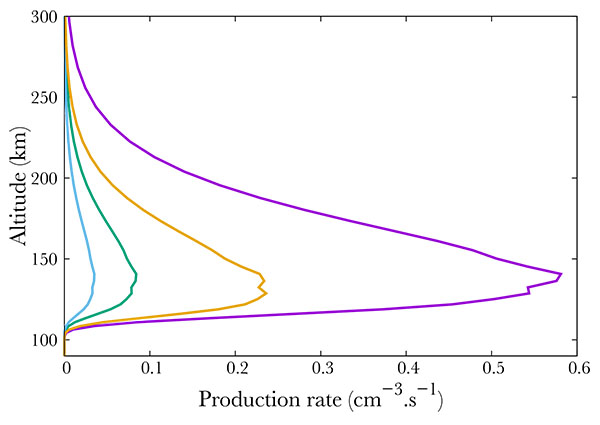 ) compares different ion productions. We show the result of NO dissociative and simple ionisation. The most important mechanism is the simple ionisation, which is comparable to the total excitation rate. The ions N+ and O+ are negligible, and correspond to less than 10% of the total absorption.
 |
Fig. (6) Production of NO+ (purple), N+ (green), O+ (blue) and total excited NO (orange). |
We aim at showing the effect of the solar and geomagnetic activity on the NO excitation and ionisation [24Cleary D. Daytime high-latitude rocket observations of the NO gamma, delta, and epsilon bands. J Geophys Res 1986; 11337-44.
[http://dx.doi.org/10.1029/JA091iA10p11337] ]. shows that the state A2Σ+ is one of the brightest in the Earth's atmosphere in general. It therefore constitutes the most attractive for studying NO in the upper atmosphere. However, the γ-band, related to the A2Σ+ state, is the desexcitation from an excited state to the ground state.
This may raise some difficulties, as self-absorption may occur, data can be distorted. Even though, since the relative behavior of the different excitation heigh profiles remains the same, we will focus on this single excitation in the following. We checked that it can be considered as the representative of the other states.
The geomagnetic (through Ap) and solar activity (through f10.7 influence the productions through the neutral atmosphere given above, and through the characteristics of the electron precipitation spectrum. To study the effects of these parameters, we will use the statistical model of [25Hardy D, Gussenhoven M, Holeman E. A statistical model of auroral electron precipitation. J Geophys Res 1985; 90: 4229-48.
[http://dx.doi.org/10.1029/JA090iA05p04229] ] to describe the precipitation. Finally, we will study independently the impact of different precipitation conditions. Even though those parameters are linked to each other, we chose to study them separately.
3.1. Influence of the Geomagnetic Activity
Here, we change the Ap index with influence both on the neutral atmosphere and on the electron precipitations.
Not surprisingly, the production increases with increasing geomagnetic activity Fig. (7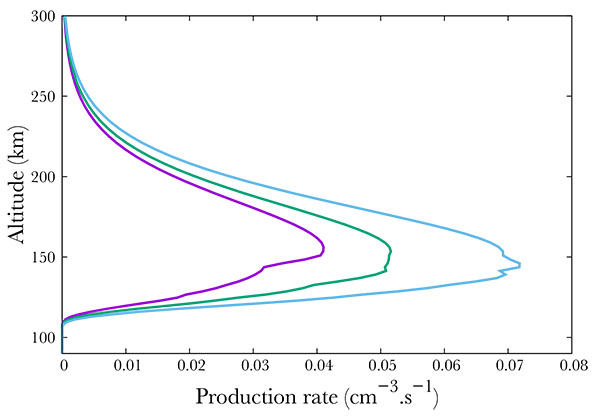 ). Following the SNOE data, we show three cases corresponding to Ap = 3, 9, 18. The neutral NO density increase results in an increase of the A2Σ+ state production, from about 0.04 cm-3s-1 to 0.05 in the mid case and 0.07 in the most active case at the peak. The geomagnetic variability is physically partly due to the enhancement of the mean energy of the electron precipitation. Indeed, in Hardy's model, increasing Ap therefore enhances this mean energy, resulting mainly in a decrease in the altitude of the peak, from 152 km in the quiet case down to about 142 in the most active.
 |
Fig. (7) Production of the A2Σ+ state of NO for Ap=3 (purple), 9 (green) and 18 (blue). |
3.2. Influence of the Solar Activity in the Nightside
Again, following SNOE data, we show in Fig. (8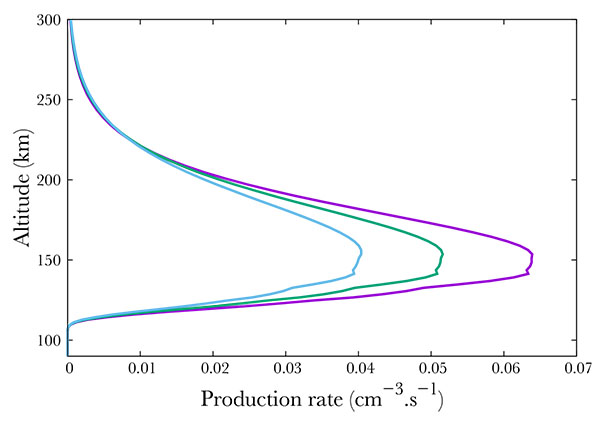 ) three cases corresponding to f10.7 = 100, 150, 210. Surprisingly, an enhancement in the solar activity results in an decrease of the A2Σ+ state production, from about 0.065 cm-3s-1 in the min f10.7 case to 0.05 in the mid case and 0.04 in the most active case. However, this is only an apparent surprise. Increasing f10.7 from 100 to 210 results in an increase at 150 km in the O density by 33\% as modeled by NRLMSISE. N2 - the main specie by far at this altitude - increases by 16%. O2 decreases by 26% while NO remains quite stable, with a small decrease of 1%. Therefore, the precipitated electrons collide preferentially with nitrogen. Less electrons are available for NO, of which the quantity is approximately constant. We would like to note that the 16% increase in N2 and the 33% increase in O are sufficient to compensate the 26% O2 density diminution.
3.3. Influence of the Precipitation
We study the impact of different precipitation conditions for 3 distinct cases. Although [26Clilverd M, Rodger CJ, Brundell J, et al. En- ergetic electron precipitation during substorm injection events: High-latitude fluxes and an unexpected midlatitude signature. J Geophys Res 2008. Space Physics. 113.
[http://dx.doi.org/10.1029/2008JA013220] ] mention electron energies up to 400 keV, we follow [27Bekerat H, Schunk R, Scherliess L. Estimation of the high-latitude topside elec- tron heat flux using DMSP plasma density measurements. J Atmos Sol Terr Phys 2007; 69: 1029-48.
[http://dx.doi.org/10.1016/j.jastp.2007.03.015] ] with a mean energy of 100 keV. The second one is a mean case with E0= 10 keV. The last one is a faint case, which represents the conditions when an aurora becomes visible with naked eyes, with E 0=1 keV [22Hultqvist B. Earth’s magnetosphere [Sl]:. Kluwer Academic Publisher 2002.]. The neutral atmosphere remains the same in the 3 runs (Ap = 9, f10.7 = 150, i.e. the mean SNOE case) in order to only distinguish the effect of precipitating electrons. The distribution function for the precipitation is a maxwellian. For each case, we chose to keep a constant number of precipitating particles.
In the first case, the A2Σ+ production peaks at 108,2 km, at 0.048 cm-3s-1. The second one peaks at 109,6 km for a production of 0.044 cm-3s-1. Finally, the last one peaks at 128,6 km with a production rate of 0.042 cm-3s-1. The neutral atmosphere remains the same in the 3 runs (Ap = 9, f10.7 = 150, i.e. the mean SNOE case).
These altitudes are in agreement with [27Bekerat H, Schunk R, Scherliess L. Estimation of the high-latitude topside elec- tron heat flux using DMSP plasma density measurements. J Atmos Sol Terr Phys 2007; 69: 1029-48.
[http://dx.doi.org/10.1016/j.jastp.2007.03.015] ] (which however focus on the neutral atmosphere) and [28Turunen E, Verronen PT, Seppälä A, et al. Impact of different energies of precipitating particles on NOx generation in the mid- dle and upper atmosphere during geomagnetic storms. J Atmos Sol Terr Phys 2009; 71: 1176-89.
[http://dx.doi.org/10.1016/j.jastp.2008.07.005] ]. [28Turunen E, Verronen PT, Seppälä A, et al. Impact of different energies of precipitating particles on NOx generation in the mid- dle and upper atmosphere during geomagnetic storms. J Atmos Sol Terr Phys 2009; 71: 1176-89.
[http://dx.doi.org/10.1016/j.jastp.2008.07.005] ] studies the altitude profile of the ionization rate in the Earth's atmosphere due to precipitating energetic electrons. The deposition peaks at 110 km, i.e. about 10 km above our maximum. This discrepancy is only apparent, as [27Bekerat H, Schunk R, Scherliess L. Estimation of the high-latitude topside elec- tron heat flux using DMSP plasma density measurements. J Atmos Sol Terr Phys 2007; 69: 1029-48.
[http://dx.doi.org/10.1016/j.jastp.2007.03.015] ] shows the deposition profile for the full atmosphere while we focus on NO only. When considering the full atmosphere, we retrieve [28Turunen E, Verronen PT, Seppälä A, et al. Impact of different energies of precipitating particles on NOx generation in the mid- dle and upper atmosphere during geomagnetic storms. J Atmos Sol Terr Phys 2009; 71: 1176-89.
[http://dx.doi.org/10.1016/j.jastp.2008.07.005] ]'s results.
 |
Fig. (8) Production of the A2Σ+ state of NO state of NO for f10.7 =100 (purple), 150 (green) and 210 (blue). |
In agreement with the work of [29Newnham D, Espy PJ, Clilverd MA, et al. Direct observations of nitric oxide produced by energetic electron precipitation into the Antarctic middle atmosphere. Geophys Res Lett 2011; 38.
[http://dx.doi.org/10.1029/2011GL048666] ] we find that the stronger the mean energy of the electrons flux, the deeper in the atmosphere the production peak. We also notice a small increase (less than a factor 2) in NO production when the total energy increases.
Fig. (9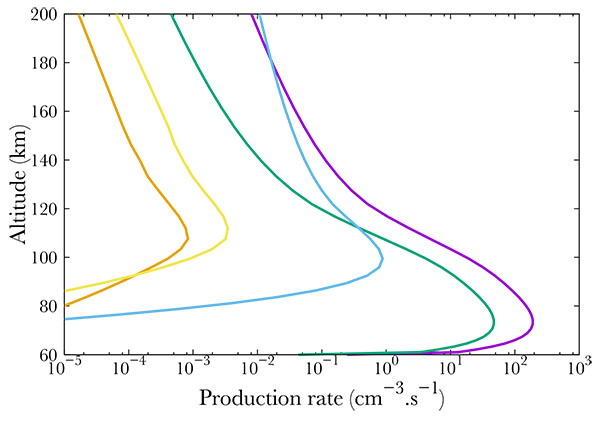 ) shows the production of different ions. Here, the precipitating electrons carry a mean energy of 100 keV and a integrated one of 1 erg.cm-2 s-1. It is important to notice that most of the energy carried by the electrons go to ionization, therefore, less energy is available for excitation. However, this last phenomenon should not be underestimated. As shown in Fig. (9) peaks may vary in altitude, depending on the gas and process (ionization or excitation). Indeed, N2+ and O2+ production peaks at 78 km whereas NO+ production peaks at 108 km.
DISCUSSION AND CONCLUSION
NO is a very minor specie in the upper atmosphere. However, its role in the global change remains unclear. It has been suggested that the upper atmospheric circulation favors the stratosphere-troposphere exchange in link with climate change through the greenhouse gas N2O [30Kracher D, Reick CH, Manzini E, Schultz MG, Stein O. Climate change reduces warming potential of nitrous oxide by an enhanced Brewer-Dobson circulation. Geophys Res Lett 2016; 43: 5851-9.
[http://dx.doi.org/10.1002/2016GL068390] ]. In parallel, chemical reactions implying NO in the atmosphere produce a significant production of various nitrous oxide (see The Physical Science Basis.
Contribution of Working Group I in [1Herzberg G. Climate Change 2014: Synthesis report contribution of working groups I, II and III to the fifth assessment report of the intergovernmental panel on climate change. Geneva: IPCC 2014.]). However, all the current studies deal only with the ground state, neglecting the excited ones. It has been questionable in which extend the nitric oxide in the upper atmosphere responds to the solar activity and then, whether the solar activity could act as a global warming cause through this effect.
Several previous studies show that NO density in the atmosphere depends on solar activity [29Newnham D, Espy PJ, Clilverd MA, et al. Direct observations of nitric oxide produced by energetic electron precipitation into the Antarctic middle atmosphere. Geophys Res Lett 2011; 38.
[http://dx.doi.org/10.1029/2011GL048666] ], [31Barth C, Tobiska WK, Siskind DE, Cleary DD. Solar-terrestrial coupling - Low- latitude thermospheric nitric oxide. Geophys Res Lett 1988; 15: 92-4.
[http://dx.doi.org/10.1029/GL015i001p00092] ]. However, NO being a minor specie in the thermosphere, the variations are very low in absolute value and compared to the variations of the major species. Because of this, variations in the excitation rate NO*remain very low as well and depend very little on solar activity.
The variability of NO (ground state) in the upper atmosphere using a diffusive transport code and a chemistry code has been studied [28Turunen E, Verronen PT, Seppälä A, et al. Impact of different energies of precipitating particles on NOx generation in the mid- dle and upper atmosphere during geomagnetic storms. J Atmos Sol Terr Phys 2009; 71: 1176-89.
[http://dx.doi.org/10.1016/j.jastp.2008.07.005] ,29Newnham D, Espy PJ, Clilverd MA, et al. Direct observations of nitric oxide produced by energetic electron precipitation into the Antarctic middle atmosphere. Geophys Res Lett 2011; 38.
[http://dx.doi.org/10.1029/2011GL048666] ,32Randall C, Harvey VL, Manney GL, et al. Stratospheric effects of energetic particle precipitation in 2003-2004. Geophys Res Lett 2005. ; 32.
[http://dx.doi.org/10.1029/2004GL022003] ]. Their computation of the ion production is made through the assumption of a value of 35 eV lost per creation of pair, close to what was computed in different gases and atmospheres in [33Simon Wedlund C, Gronoff G, Lilensten J, Ménager H, Barthélemy M. Comprehensive calculation of the energy per ion pair or W values for five major planetary upper atmospheres. Ann Geophys 2011; 29: 187-95.
[http://dx.doi.org/10.5194/angeo-29-187-2011] ]. Using a more sophisticated transport code and computing not only the ion production but also all the excitation ones, we find the same amplitude of variability than what they get for the neutral atmosphere.

In order to help further work to improve their models, we provide in the Appendix the productions of all the 22 excited states and of NO+ in the middle case above (Ap = 9, f10.7 = 150) at a latitude of 70°. From our study, this case is representative of any solar and geomagnetic activity level at high latitude. The electron flux mean energy is E0=500 eV for a total flux 0.1 erg.cm-2s-1. We used a maxwellian distribution in energy and an isotropic distribution in pitch angles.
Although the suggested mechanisms to link the solar activity to the climate through excited NO production are typically nocturnal, it would be interesting in the future to proceed to the same computation in the daytime. NO excitation by photons is a resonant phenomena.
This means that there is only one cross-section at a single energy for each excited state. However, we could not find extensive data on this subject. The most complete photo absorption cross section set is found in [34Bethke G. Oscillator Strengths in the Far Ultraviolet. I. Nitric Oxide. J Chem Phys 1989; 31: 662-8.
[http://dx.doi.org/10.1063/1.1730443] ]. It provides the oscillator strengths for a reduced set of states. A thorough effort should be performed to determine these cross sections.
NOTES
ETHICS APPROVAL AND CONSENT TO PARTICIPATE
Not applicable.
HUMAN AND ANIMAL RIGHTS
No Animals/Humans were used for studies that are base of this research.
CONSENT FOR PUBLICATION
Not applicable.
CONFLICT OF INTEREST
The authors declare no conflict of interest, financial or otherwise.
ACKNOWLEDGEMENTS
Declared none.
REFERENCES
| [1] | Herzberg G. Climate Change 2014: Synthesis report contribution of working groups I, II and III to the fifth assessment report of the intergovernmental panel on climate change. Geneva: IPCC 2014. |
| [2] | Lilensten J, Dudok De Wit T, Matthes K. response to a changing Sun [Sl]: EDPS Ed, 2015. 2015. |
| [3] | Rozanov EV, Egorova TA, Shapiro AI, Schmutz WK. Modeling of the atmospheric response to a strong decrease of the solar activity. Proceedings of the IAU 2011; 7(S286):215-24. |
| [4] | Seppälä A, Funke B, Verronen P. Impact of energetic particle precipitation on atmospheric chemistry and climate. In: 2015; pp. LILENSTEN, T D D W K M Earth’s climate response to a changing sun. 2015; pp. 267-72. [S.l.]: EDPS Ed. |
| [5] | Johnston H. Reduction of stratospheric ozone by nitrogen oxide catalysts from supersonic transport exhaust. Science 1971; 173(3996): 517-22. [http://dx.doi.org/10.1126/science.173.3996.517] [PMID: 17738433] |
| [6] | Rozanov EV, Calisto M, Egorova TA, Peter T, Schmutz WK. Influence of the precipitating energetic particles on atmospheric chemistry and climate. Surv Geophys 2012; 33: 483-501. [http://dx.doi.org/10.1007/s10712-012-9192-0] |
| [7] | Siskind D, Barth C, Russel J. A climatology of nitric oxide in the meso- sphere and thermosphere. Adv Space Res 1998; 1353-62. [http://dx.doi.org/10.1016/S0273-1177(97)00743-6] |
| [8] | Bermejo-Pantaleón D, Funke B, López-Puertas M, et al. Global observations of thermospheric temperature and nitric oxide from MIPAS spectra at 5.3 μm. J Geophys Res Space Physics 2011; 116. [http://dx.doi.org/10.1029/2011JA016752] |
| [9] | Barth C, Mankoff KD, Bailey SM, Solomon SC. Global observations of nitric oxide in the thermosphere. J Geophys Res 2003; 108. |
| [10] | Smith AK, Garcia PR, Marsh DR, Richter JH. WACCM simulations of the mean circulation and trace species transport in the winter mesosphere. J Geophys Res (Atmospheres) 2011; 116. [http://dx.doi.org/10.1029/2011JD016083] |
| [11] | Seppälä A, Matthes K, Randall CE, Mironova IA. What is the solar influence on climate? Overview of activities during CAWSES-II. Prog. Earth Planet Sci 2014; 1:24. |
| [12] | Swartz W, Nisbet J. Revised calculations of F region ambient electron heating by photoelectrons. J Geophys Res 1972; 77 |
| [13] | Brunger M, Campbell L, Cartwright DC, Middleton AG, Mojarrabi B, Teubner PGO. Electron-impact excitation of Rydberg and valence electronic states of nitric oxide: II. Integral cross sections. J Phys B 2000; 33: 809-19. [http://dx.doi.org/10.1088/0953-4075/33/4/315] |
| [14] | Lilensten J, Cander L. Calibration of the TEC derived from GPS measurements and from ionospheric models using the EISCAT radar. J Atmos Sol Terr Phys 2003; 65: 833-42. [http://dx.doi.org/10.1016/S1364-6826(03)00087-7] |
| [15] | Lummerzheim D, Lilensten J. Electron transport and energy degradation in the iono- sphere: Evaluation of the numerical solution, comparison with laboratory experi- ments and auroral observations. Ann Geophys 1994; 1039-51. [http://dx.doi.org/10.1007/s00585-994-1039-7] |
| [16] | Lummerzheim D, Rees M, Anderson H. Angular dependent transport of auroral electrons in the upper atmosphere. Planet Space Sci 1989; 109-29. [http://dx.doi.org/10.1016/0032-0633(89)90074-3] |
| [17] | Bilitza D, Brown SA, Wang MY, Souza JR, Roddy PA. Measurements and IRI model predictions during the recent solar minimum. J Atmos Sol Terr Phys 2012; 86: 99-106. [http://dx.doi.org/10.1016/j.jastp.2012.06.010] |
| [18] | Picone J, Brown SA, Wang MY, Souza JR, Roddy PA. NRLMSISE-00 empirical model of the atmosphere: Statistical comparisons and scientific issues J. Geophys Res Space Physics 2002; 107. |
| [19] | Witasse O, Lilensten J, Lathuillère C, Blelly PL. Modeling the OI 630.0 and 557.7 nm thermospheric dayglow during EISCAT-WINDII coordinated measurements. J Geophys Res 1999; 104: 24639-56. [http://dx.doi.org/10.1029/1999JA900260] |
| [20] | Culot F, Lathuillère C, Lilensten J, Witasse O. The OI 630.0 and 557.7nm day- glow measured by WINDII and modeled by TRANSCAR. Ann Geophys 2004; 22: 1947-60. [http://dx.doi.org/10.5194/angeo-22-1947-2004] |
| [21] | Fang X, Randall CE, Lummerzheim D, et al. Electron impact ionization: A new parameterization for 100 eV to 1 MeV electrons. J Geophys Res 2008; 113. |
| [22] | Hultqvist B. Earth’s magnetosphere [Sl]:. Kluwer Academic Publisher 2002. |
| [23] | Cartwright D, Brunger MJ, Campbell L, Mojarrabi B, Teubner PJO. Nitric oxide excited under auroral conditions: Excited state densities and band emissions. J Geophys Res 2000. ; 105:20857-67. [http://dx.doi.org/10.1029/1999JA000333] |
| [24] | Cleary D. Daytime high-latitude rocket observations of the NO gamma, delta, and epsilon bands. J Geophys Res 1986; 11337-44. [http://dx.doi.org/10.1029/JA091iA10p11337] |
| [25] | Hardy D, Gussenhoven M, Holeman E. A statistical model of auroral electron precipitation. J Geophys Res 1985; 90: 4229-48. [http://dx.doi.org/10.1029/JA090iA05p04229] |
| [26] | Clilverd M, Rodger CJ, Brundell J, et al. En- ergetic electron precipitation during substorm injection events: High-latitude fluxes and an unexpected midlatitude signature. J Geophys Res 2008. Space Physics. 113. [http://dx.doi.org/10.1029/2008JA013220] |
| [27] | Bekerat H, Schunk R, Scherliess L. Estimation of the high-latitude topside elec- tron heat flux using DMSP plasma density measurements. J Atmos Sol Terr Phys 2007; 69: 1029-48. [http://dx.doi.org/10.1016/j.jastp.2007.03.015] |
| [28] | Turunen E, Verronen PT, Seppälä A, et al. Impact of different energies of precipitating particles on NOx generation in the mid- dle and upper atmosphere during geomagnetic storms. J Atmos Sol Terr Phys 2009; 71: 1176-89. [http://dx.doi.org/10.1016/j.jastp.2008.07.005] |
| [29] | Newnham D, Espy PJ, Clilverd MA, et al. Direct observations of nitric oxide produced by energetic electron precipitation into the Antarctic middle atmosphere. Geophys Res Lett 2011; 38. [http://dx.doi.org/10.1029/2011GL048666] |
| [30] | Kracher D, Reick CH, Manzini E, Schultz MG, Stein O. Climate change reduces warming potential of nitrous oxide by an enhanced Brewer-Dobson circulation. Geophys Res Lett 2016; 43: 5851-9. [http://dx.doi.org/10.1002/2016GL068390] |
| [31] | Barth C, Tobiska WK, Siskind DE, Cleary DD. Solar-terrestrial coupling - Low- latitude thermospheric nitric oxide. Geophys Res Lett 1988; 15: 92-4. [http://dx.doi.org/10.1029/GL015i001p00092] |
| [32] | Randall C, Harvey VL, Manney GL, et al. Stratospheric effects of energetic particle precipitation in 2003-2004. Geophys Res Lett 2005. ; 32. [http://dx.doi.org/10.1029/2004GL022003] |
| [33] | Simon Wedlund C, Gronoff G, Lilensten J, Ménager H, Barthélemy M. Comprehensive calculation of the energy per ion pair or W values for five major planetary upper atmospheres. Ann Geophys 2011; 29: 187-95. [http://dx.doi.org/10.5194/angeo-29-187-2011] |
| [34] | Bethke G. Oscillator Strengths in the Far Ultraviolet. I. Nitric Oxide. J Chem Phys 1989; 31: 662-8. [http://dx.doi.org/10.1063/1.1730443] |
| [35] | Lilensten J, Blelly P. The TEC and F2 parameters as tracers of the ionosphere and thermosphere. J Atmos Sol Terr Phys 2002; 64: 775-93. [http://dx.doi.org/10.1016/S1364-6826(02)00079-2] |
Endorsements
Browse Contents
Table of Contents
- INTRODUCTION
- NITRIC MONOXIDE IN THE ATMOSPHERE
- NO Production
- NO Destruction
- NO Vertical Transport
- MODELING2This kinetic model can be coupled with a fluid one, which is not the case here (Lilensten & Blelly, The TEC and F2 parameters as tracers of the ionosphere and thermosphere, 2002).
- RESULTS
- DISCUSSION AND CONCLUSION