- Home
- About Journals
-
Information for Authors/ReviewersEditorial Policies
Publication Fee
Publication Cycle - Process Flowchart
Online Manuscript Submission and Tracking System
Publishing Ethics and Rectitude
Authorship
Author Benefits
Reviewer Guidelines
Guest Editor Guidelines
Peer Review Workflow
Quick Track Option
Copyediting Services
Bentham Open Membership
Bentham Open Advisory Board
Archiving Policies
Fabricating and Stating False Information
Post Publication Discussions and Corrections
Editorial Management
Advertise With Us
Funding Agencies
Rate List
Kudos
General FAQs
Special Fee Waivers and Discounts
- Contact
- Help
- About Us
- Search


The Open Atmospheric Science Journal
(Discontinued)
ISSN: 1874-2823 ― Volume 14, 2020
The Predictability of Blocking Character in the Northern Hemisphere Using an Ensemble Forecast System
DeVondria D. Reynolds1, Anthony R. Lupo1, *, Andrew D. Jensen2, Patrick S. Market1
Abstract
Introduction:
Some weather extremes are the result of atmospheric blocking, which can be responsible for the stagnation of weather patterns. These large-scale quasi-stationary mid-latitude flow regimes can result in significant temperature and precipitation anomalies over the regions that the blocking event impacts or in the upstream and downstream regions.
Methods:
The ability to predict periods of anomalous weather conditions due to atmospheric blocking is a major problem for medium-range forecasting. Analyzing the National Centers for Environmental Prediction (NCEP) Ensemble 500-hPa pressure level heights (240 hrs.) ten-day forecasts, and using the University of Missouri blocking archive to identify blocking events, the forecasted onset, duration, and intensity of model blocking events are compared to observed blocks.
Results and Discussion:
The observed blocking events were identified using the University of Missouri blocking archive. Comparing these differences using four Northern Hemisphere case studies occurring over a one-year period across the Northern Hemisphere has shown the continued need for improvement in the duration and intensity of blocking events. Additionally, a comparison of the block intensity to a diagnostic known as the Integrated Regional Enstrophy (IRE) was performed in order to determine if there is a correlation between IRE and these quantities.
Conclusion:
Having a better understanding of block persistence and their associated anomalies can help society prepare for the damage they can cause.
Article Information

Identifiers and Pagination:
Year: 2019Volume: 13
First Page: 13
Last Page: 28
Publisher Id: TOASCJ-13-13
DOI: 10.2174/1874282301913010013
Article History:
Received Date: 20/05/2019Revision Received Date: 29/07/2019
Acceptance Date: 07/08/2019
Electronic publication date: 30/09/2019
open-access license: This is an open access article distributed under the terms of the Creative Commons Attribution 4.0 International Public License (CC-BY 4.0), a copy of which is available at: https://creativecommons.org/licenses/by/4.0/legalcode. This license permits unrestricted use, distribution, and reproduction in any medium, provided the original author and source are credited.
* Address correspondence to this author at the Atmospheric Science Program School of Natural Resources, 302 ABNR Building University of Missouri Columbia, MO, USA, 65211; Tel: +1-573-489-8457;
E-mail: lupoa@missouri.edu
| Open Peer Review Details | |||
|---|---|---|---|
| Manuscript submitted on 20-05-2019 |
Original Manuscript | The Predictability of Blocking Character in the Northern Hemisphere Using an Ensemble Forecast System | |
1. INTRODUCTION
Atmospheric blocking has been defined in previous work using a number of different criterion including; as a persistent height anomaly [1Shukla JJ, Mo KC. Seasonal and geographical variation of blocking. Mon Weather Rev 1983; 111: 388-402.
[http://dx.doi.org/10.1175/1520-0493(1983)111<0388:SAGVOB>2.0.CO;2] ], as a weakness in the 500-hPa winds [2Lejenas H, Okland H. Characteristics of northern hemisphere blocking as determined from a long time series of observational data. Tellus 1983; 35A: 350-62.
[http://dx.doi.org/10.1111/j.1600-0870.1983.tb00210.x] ], or using Potential Vorticity techniques [3Pelly JL, Hoskins BJ. How well does the ECMWF ensemble prediction system predict blocking. Q J R Meteorol Soc 2003; 129: 1683-703.
[http://dx.doi.org/10.1256/qj.01.173] , 4Schwierz C, Croci-Maspoli M, Davies HC. Perspicacious indicators of atmospheric blocking. Geophys Res Lett 2004; 31(6)
[http://dx.doi.org/10.1029/2003GL019341] ]. Recently, the efficacy of these blocking indexes was examined and it was determined that each captures the basic essence of the Northern Hemisphere blocking climatology, but the definitions result in some key differences. The blocking definition proposed by the study [8Lupo AR, Smith PJ. Climatological features of blocking anticyclones in the Northern Hemisphere. Tellus 1995; 47A: 439-56.
[http://dx.doi.org/10.3402/tellusa.v47i4.11527] ] included many characteristics such as onset location, duration, half-wavelength, and Block Intensity (BI). Thus, a generic definition of blocking [9Reynolds DD, Lupo AR, Jensen AD, Market PS. The predictability of Northern Hemisphere blocking using an ensemble mean forecast system. Electronic Conference on Atmospheric Science 2017 July 16-31; ]. is that they are a non-linear, large-scale phenomenon that occurs in the atmospheric pressure field and results in a regionally quasi-stationary steady state for the mid-latitude flow.
Cyclonic wave breaking, which results in the upscale cascade of enstrophy, is an important process for maintaining some mid-latitude stationary general circulation or climatological features or mid-latitude climate [10Matsueda M, Kyouda M, Toth Z, Tanaka HL, Tsuyuki T. Predictability of an atmospheric blocking event that occurred on 15 December 2005. Mon Weather Rev 2011; 139: 2455-70.
[http://dx.doi.org/10.1175/2010MWR3551.1] ]. This cyclonic wave breaking can contribute to the support of a persistent blocking episode. Several studies have shown these episodes lead to anomalous temperature and/or precipitation anomalies within the blocked region or the surrounding area [10Matsueda M, Kyouda M, Toth Z, Tanaka HL, Tsuyuki T. Predictability of an atmospheric blocking event that occurred on 15 December 2005. Mon Weather Rev 2011; 139: 2455-70.
[http://dx.doi.org/10.1175/2010MWR3551.1] -12Nunes MJ, Lupo AR, Lebedeva MG, Chendev YG, Solovyov AB. The occurrence of extreme monthly temperatures and precipitation in two global regions 2017.
[http://dx.doi.org/10.1080/23754931.2017.1286253] ]. Blocking events have been associated also with extreme weather, for both temperature [11Hussain A, Lupo AR. Scale and stability analysis of blocking events from 2002-2004: A case study of an unusually persistent blocking event leading to a heat wave in the Gulf of Alaska during August 2004. Adv Meteor 2010; 15.
[http://dx.doi.org/10.1155/2010/610263] -13Sillmann J, Mischa MC, Kallache M, Katz RW. Extreme cold winter temperatures in Europe under the influence of North Atlantic atmospheric blocking. J Clim 2011; 24(22): 5899-913.
[http://dx.doi.org/10.1175/2011JCLI4075.1] ] and precipitation regimes as well [14Bissolli P, Friedrich K, Rapp J, Ziese M. Flooding in eastern central Europe in May 2010—reasons, evolution and climatological assessment. Weather 2011; 66(6): 147-53.
[http://dx.doi.org/10.1002/wea.759] , 15Webster P, Toma VE, Kim H-M. Were the 2010 Pakistan floods predictable? Geophys Res Lett 2011; 38: 5.].
Others [16Lupo AR, Smith PJ. Planetary and Synoptic-Scale Interactions During the Life Cycle of a Mid-Latitude Blocking Anticyclone Over the North Atlantic. Tellus. Special Issue: The Life Cycles of Extratropical Cyclones 1995; 47A: 575-96., 17Lupo AR, Bosart LF. An Analysis of a Relatively Rare Case of Continental Blocking. Q J R Meteorol Soc 1999; 125: 107-38.
[http://dx.doi.org/10.1002/qj.49712555308] ] describe the relationship between developing upstream cyclones and the onset and/or maintenance of blocking in some detail, including a description of the phase relationship between the large and synoptic-scale wave and the development of a jet maximum on the upstream flank of the blocking events. These and others find that cyclones that develop 10 - 50 degrees longitude upstream (about ¼ wavelength) of the large-scale feature or blocking event are associated with the onset of blocking. These cyclones typically deepen rapidly or explosively [8Lupo AR, Smith PJ. Climatological features of blocking anticyclones in the Northern Hemisphere. Tellus 1995; 47A: 439-56.
[http://dx.doi.org/10.3402/tellusa.v47i4.11527] , 16Lupo AR, Smith PJ. Planetary and Synoptic-Scale Interactions During the Life Cycle of a Mid-Latitude Blocking Anticyclone Over the North Atlantic. Tellus. Special Issue: The Life Cycles of Extratropical Cyclones 1995; 47A: 575-96., 17Lupo AR, Bosart LF. An Analysis of a Relatively Rare Case of Continental Blocking. Q J R Meteorol Soc 1999; 125: 107-38.
[http://dx.doi.org/10.1002/qj.49712555308] ].
Also, the study [10Matsueda M, Kyouda M, Toth Z, Tanaka HL, Tsuyuki T. Predictability of an atmospheric blocking event that occurred on 15 December 2005. Mon Weather Rev 2011; 139: 2455-70.
[http://dx.doi.org/10.1175/2010MWR3551.1] , 18Lupo AR, Mokhov II, Akperov MG, Cherokulsky AV, Athar H. A dynamic analysis of the role of the planetary and synoptic scale in the summer of 2010 blocking episodes over the European part of Russia. Adv Meteorol 2012; 11.
[http://dx.doi.org/10.1155/2012/584257] ], and many other studies examined the persistent and severe summer heatwave of 2010 over Eastern Europe and Russia. There were more than 50,000 deaths in Russia alone including more than 1,600 people who drowned as they entered water to escape the heat [9Reynolds DD, Lupo AR, Jensen AD, Market PS. The predictability of Northern Hemisphere blocking using an ensemble mean forecast system. Electronic Conference on Atmospheric Science 2017 July 16-31; ]. This heatwave caused large economic losses including the crops that were damaged. An increase in wildfires and smog levels in major Russian cities led to severe illness as well. The heat wave was the result of three atmospheric blocking events that covered the Euro-Russian region persisting from late June to mid-August [18Lupo AR, Mokhov II, Akperov MG, Cherokulsky AV, Athar H. A dynamic analysis of the role of the planetary and synoptic scale in the summer of 2010 blocking episodes over the European part of Russia. Adv Meteorol 2012; 11.
[http://dx.doi.org/10.1155/2012/584257] ]. Research regarding the future occurrence of blocking events demonstrates generally that these events will continue to play a role in the occurrence of extremes that are expected in association with changes in climate [19Woollings T, Barriopedro D, Methven J, et al. Blocking and its response to climate change. Curr Clim Change Rep 2018; 4(3): 287-300.
[http://dx.doi.org/10.1007/s40641-018-0108-z] [PMID: 30956938] ].
Typically, weather forecast models have under-forecast the occurrence of blocking [10Matsueda M, Kyouda M, Toth Z, Tanaka HL, Tsuyuki T. Predictability of an atmospheric blocking event that occurred on 15 December 2005. Mon Weather Rev 2011; 139: 2455-70.
[http://dx.doi.org/10.1175/2010MWR3551.1] ]. During the 2010 summer season, the inability of the models to capture adequately the timing of blocking onset, decay, and maintenance of blocking caused the under-forecasting of extreme surface temperatures in Eastern Europe and Russia [10Matsueda M, Kyouda M, Toth Z, Tanaka HL, Tsuyuki T. Predictability of an atmospheric blocking event that occurred on 15 December 2005. Mon Weather Rev 2011; 139: 2455-70.
[http://dx.doi.org/10.1175/2010MWR3551.1] ]. Studies have shown that numerical model forecasts have become reliable for about one to seven days, but they have an absolute limit of about 10-14 days [20Lorenz EN. Deterministic Nonperiodic Flow. J Atmos Sci 1963; 130-141.
[http://dx.doi.org/10.1175/1520-5030469] -22Jensen AD, Lupo AR, Mokhov II, Akperov MG, Sun F. The dynamic character of Northern Hemisphere flow regimes in a near term climate change projection. Atmosphere 2018; 9(1): 27.
[http://dx.doi.org/10.3390/atmos9010027] ]. The failure of operational models in forecasting is a problem for anticipating blocking onset, and especially decay. Numerical model predictions are subject to fail for various reasons including, but not limited to; parameterization errors, lack of data, measurement errors, errors in initial conditions, and error growth [23Lupo AR, Li YC, Feng ZC, Fox NI, Rabinowitz JL, Simpson MA. Sensitive Versus Rough Dependence in Initial Conditions in Atmospheric Flow Regimes. Atmosphere 2016; 7: 157.
[http://dx.doi.org/10.3390/atmos7120157] , 24Li, YC Linear Hydrodynamic Stability. Not Am Math Soc 2018; 65(10): 1255-9.].
A previous study of blocking predictability [25Tibaldi SS, Tosi EE, Navarra AA, Pedulli LL. Northern and Southern Hemisphere Seasonal Variability of Blocking Frequency and Predictability. Mon Wea Rev 1994; 122: 1971-2003.
[http://dx.doi.org/10.1175/1520-0493(1994)122<1971:NASHSV>2.0.CO;2] ] investigated the frequency, seasonal variability, and onset of blocking using the European Centre for Medium-Range Weather Forecasts (ECMWF) model. They analyzed blocking events over a seven-year period in both the Northern and Southern Hemisphere. Their study [25Tibaldi SS, Tosi EE, Navarra AA, Pedulli LL. Northern and Southern Hemisphere Seasonal Variability of Blocking Frequency and Predictability. Mon Wea Rev 1994; 122: 1971-2003.
[http://dx.doi.org/10.1175/1520-0493(1994)122<1971:NASHSV>2.0.CO;2] ] found that Atlantic blocking events occurred more often in the spring, while Pacific blocks were frequent in the winter including a weak secondary peak in summer. Block onset was less predictable during the winter and summer seasons when compared with the spring season in the Northern Hemisphere. They also found that the model estimated block intensity most faithfully during the spring, but that it was over-estimated in the fall. Persistence was predicted better in the Atlantic Region when compared Pacific Region blocking events. Additionally, the study [25Tibaldi SS, Tosi EE, Navarra AA, Pedulli LL. Northern and Southern Hemisphere Seasonal Variability of Blocking Frequency and Predictability. Mon Wea Rev 1994; 122: 1971-2003.
[http://dx.doi.org/10.1175/1520-0493(1994)122<1971:NASHSV>2.0.CO;2] ] suggested that a small number of case studies needed to be investigated in more detail in order to determine why models failed in block forecasts.
Then an ensemble model was used to examine a 1985 winter season blocking case study occurring within the Eastern Atlantic Ocean and Western Europe region focusing on the predictability of onset and the planetary/synoptic-scale preconditioning [26Colucci SJ, Baumhefner DP. Numerical prediction of the onset of blocking: A case study with forecast ensembles. Mon Weather Rev 1998; 126: 773-84.
[http://dx.doi.org/10.1175/1520-0493(1998)126<0773:NPOTOO>2.0.CO;2] ]. They used a 10-member ensemble suite available through the Community Climate Model (CCM) group at the National Center for Atmospheric Research (NCAR). A comparison of the predictability for non-blocking planetary-scale features relative to blocking events motivated this study. Relaxing the blocking criterion, they found that blocking events were less predictable as the lead-time increased [27Colucci SJ, Alberta TL. Planetary-scale climatology of explosive cyclogenesis and blocking. Mon Weather Rev 1996; 124: 2509-20.
[http://dx.doi.org/10.1175/1520-0493(1996)124<2509:PSCOEC>2.0.CO;2] ]. However, the degree to which initialization (on planetary or synoptic-scales) or model error/bias were the key factors in forecast accuracy could not be resolved [26Colucci SJ, Baumhefner DP. Numerical prediction of the onset of blocking: A case study with forecast ensembles. Mon Weather Rev 1998; 126: 773-84.
[http://dx.doi.org/10.1175/1520-0493(1998)126<0773:NPOTOO>2.0.CO;2] ]. All ensemble members failed to locate block onset and persistence accurately at lead times greater than seven days.
In a follow-up study, the study [28Watson JS, Colucci SJ. Evaluation of ensemble predictions of blocking in the NCEP Global Spectral Model. Mon Weather Rev 2002; 130: 3008-21.
[http://dx.doi.org/10.1175/1520-0493(2002)130<3008:EOEPOB>2.0.CO;2] ] eliminated that model bias by calibrating the National Centers for Environmental Prediction (NCEP) Global Spectral Model (GSM) ensemble forecast system. Using the technique of forecasting from different initial times on the same day [29Brankovic C, Palmer TN, Molteni F, Tibaldi S, Cubasch U. Extended-range predictions with ECMWF models: Time-lagged ensemble forecasting. Q J R Meteorol Soc 1990; 116: 857-912.
[http://dx.doi.org/10.1002/qj.49711649405] ], a probabilistic forecast for blocking can be created. Skill scores were calculated and tested for accuracy in order to create the calibrated forecast. Then, bias was identified using the Heidke Skill Score (HSS) and False Alarm Rate (FAR) [30Wilks DS. Statistical Methods in the Atmospheric Sciences: An Introduction 1995; 467: 520.]. The probabilistic calibrated forecasts of blocking onset and frequency were compared to the NCEP reanalysis and the un-calibrated ensemble forecast during the cool season (September to May) from 1959 to 1998 within the Atlantic and Pacific Regions. They concluded that Atlantic Region probabilistic calibrated forecast showed great improvements compared to un-calibrated ensemble forecasts, however, due to the lack of reliable data over the Pacific region, the forecasts were not as successful [28Watson JS, Colucci SJ. Evaluation of ensemble predictions of blocking in the NCEP Global Spectral Model. Mon Weather Rev 2002; 130: 3008-21.
[http://dx.doi.org/10.1175/1520-0493(2002)130<3008:EOEPOB>2.0.CO;2] ].
Predictability in an ensemble forecast system using the Integrated Regional Enstrophy (IRE) technique originally formulated by [31Jensen AD, Lupo AR. Using enstrophy advection as a diagnostic to identify blocking regime transition. Q J R Meteorol Soc 2013; 139: 2-7.
[http://dx.doi.org/10.1002/qj.2248] ] and its derivative (DIRE) during the life cycle of two blocking events were examined in the work [32Dymnikov VP, Kazantsev YV, Kharin VV. Information entropy and local Lyapunov exponents of barotropic atmospheric circulation. Izv, Atmos Ocean Phys 1992; 28: 425-32.]. They found that the ensemble mean for the Global Ensemble Forecast System (GEFS) model performed better than the control forecast in representing these quantities, but individual ensemble members better correlated to the observed event regardless of the model resolution or the analyses. However, none of these studies cited above examined the detailed list of block characteristics at onset as in [8Lupo AR, Smith PJ. Climatological features of blocking anticyclones in the Northern Hemisphere. Tellus 1995; 47A: 439-56.
[http://dx.doi.org/10.3402/tellusa.v47i4.11527] , 33Wiedenmann JM, Lupo AR, Mokhov II, Tikhonova EA. The climatology of blocking anticyclones for the northern and southern hemispheres: Block intensity as a diagnostic. J Clim 2002; 15: 3459-73.
[http://dx.doi.org/10.1175/1520-0442(2002)015<3459:TCOBAF>2.0.CO;2] ] including BI.
Following the suggestion [25Tibaldi SS, Tosi EE, Navarra AA, Pedulli LL. Northern and Southern Hemisphere Seasonal Variability of Blocking Frequency and Predictability. Mon Wea Rev 1994; 122: 1971-2003.
[http://dx.doi.org/10.1175/1520-0493(1994)122<1971:NASHSV>2.0.CO;2] ], this study will be similar to the study [9Reynolds DD, Lupo AR, Jensen AD, Market PS. The predictability of Northern Hemisphere blocking using an ensemble mean forecast system. Electronic Conference on Atmospheric Science 2017 July 16-31; , 34Jensen AD, Lupo AR, Mokhov II, Akperov MG, Reynolds DD. Integrated regional enstrophy and block intensity as a measure of Kolmogorov Entropy. Atmosphere 2017; 8(12): 237.
[http://dx.doi.org/10.3390/atmos8120237] ] and analyze four quasi-randomly chosen Northern Hemisphere (NH) blocking events during the period from 1 May, 2016 to 30 April, 2017 in order to compare the dynamics of both Pacific and Atlantic Region events as well as strong and weak blocking events. Using the National Centers for Environmental Prediction (NCEP) ensemble model mean forecasts and the NCEP/National Center for Atmospheric Research (NCAR) re-analyses, a more detailed comparison between model forecast and observed blocking events as in the sudy [9Reynolds DD, Lupo AR, Jensen AD, Market PS. The predictability of Northern Hemisphere blocking using an ensemble mean forecast system. Electronic Conference on Atmospheric Science 2017 July 16-31; ], but in more detail. This study will focus on the model forecast of block onset/decay, longevity, BI [33Wiedenmann JM, Lupo AR, Mokhov II, Tikhonova EA. The climatology of blocking anticyclones for the northern and southern hemispheres: Block intensity as a diagnostic. J Clim 2002; 15: 3459-73.
[http://dx.doi.org/10.1175/1520-0442(2002)015<3459:TCOBAF>2.0.CO;2] ], and block location. This study will also examine the possible correlation between BI and IRE suggested by [9Reynolds DD, Lupo AR, Jensen AD, Market PS. The predictability of Northern Hemisphere blocking using an ensemble mean forecast system. Electronic Conference on Atmospheric Science 2017 July 16-31; , 34Jensen AD, Lupo AR, Mokhov II, Akperov MG, Reynolds DD. Integrated regional enstrophy and block intensity as a measure of Kolmogorov Entropy. Atmosphere 2017; 8(12): 237.
[http://dx.doi.org/10.3390/atmos8120237] ], and the implied physical relationship between a developing upstream surface cyclone and block onset [16Lupo AR, Smith PJ. Planetary and Synoptic-Scale Interactions During the Life Cycle of a Mid-Latitude Blocking Anticyclone Over the North Atlantic. Tellus. Special Issue: The Life Cycles of Extratropical Cyclones 1995; 47A: 575-96., 17Lupo AR, Bosart LF. An Analysis of a Relatively Rare Case of Continental Blocking. Q J R Meteorol Soc 1999; 125: 107-38.
[http://dx.doi.org/10.1002/qj.49712555308] ]. The authors are not aware of another research group that examined the detailed quantitative character of precursor cyclones and the associated blocking event and their physical relationship. Section two will discuss the data and methods used to perform this research; section three will examine the synoptic aspects of each blocking event as well as IRE and teleconnections; section four will compare the ensemble modeled blocking and observed data.
2. DATA AND METHODS
2.1. Data
The National Meteorological Center (NMC - now NCEP) began operational ensemble forecasting in 1992 [35Toth Z, Kalnay E. Ensemble forecasting at NMC: The generation of perturbations. Bull Am Meteorol Soc 1993; 74: 2317-30.
[http://dx.doi.org/10.1175/1520-0477(1993)074<2317:EFANTG>2.0.CO;2] , 36Tracton M, Kalnay E. Operational ensemble prediction at the national meteorological center: Practical aspects. Weather Forecast 1993; 8: 379-98.
[http://dx.doi.org/10.1175/1520-0434(1993)008<0379:OEPATN>2.0.CO;2] ]. This model had a control simulation and 14 members and used a lower-resolution (T62, equivalent to ~210 km) version of a Medium-Range Forecast (MRF) model [35Toth Z, Kalnay E. Ensemble forecasting at NMC: The generation of perturbations. Bull Am Meteorol Soc 1993; 74: 2317-30.
[http://dx.doi.org/10.1175/1520-0477(1993)074<2317:EFANTG>2.0.CO;2] , 36Tracton M, Kalnay E. Operational ensemble prediction at the national meteorological center: Practical aspects. Weather Forecast 1993; 8: 379-98.
[http://dx.doi.org/10.1175/1520-0434(1993)008<0379:OEPATN>2.0.CO;2] ]. The ensemble system now provides 17 global forecasts and produces products that can be used for medium-range forecasting applications. In this work, the “spaghetti” plot, which provides two 500 hPa height field contours chosen to represent the mid-latitude and subtropical flow from each ensemble member. The ensemble mean plot consists of representative contours from the mean 500-hPa height field obtained from each ensemble member [35Toth Z, Kalnay E. Ensemble forecasting at NMC: The generation of perturbations. Bull Am Meteorol Soc 1993; 74: 2317-30.
[http://dx.doi.org/10.1175/1520-0477(1993)074<2317:EFANTG>2.0.CO;2] ].
The datasets used here were provided by the NCEP Global Ensemble Forecast System (GEFS) ensemble mean forecast product and the NCEP/NCAR Reanalyses from 1 May, 2016 - 30 April, 2017. The GEFS NH 500 hPa height fields (m) for the mean and spaghetti plots were used and were available for ten days (240 h). The model data resolution used here is 1o x 1o latitude and longitude grid. The characteristics derived from these data were the block onset and location, duration, and BI [33Wiedenmann JM, Lupo AR, Mokhov II, Tikhonova EA. The climatology of blocking anticyclones for the northern and southern hemispheres: Block intensity as a diagnostic. J Clim 2002; 15: 3459-73.
[http://dx.doi.org/10.1175/1520-0442(2002)015<3459:TCOBAF>2.0.CO;2] ]. Then the modeled and the corresponding observed blocking characteristics were compared then to the corresponding observed atmospheric blocking events. The NCEP/NCAR re-analyses [37Kalnay EE, Kanamitsu MM, Kistler R, et al. The NCEP/NCAR 40-Year Reanalysis Project. Bull Am Meteorol Soc 1996; 77: 437-71.
[http://dx.doi.org/10.1175/1520-0477(1996)077<0437:TNYRP>2.0.CO;2] ] are used to diagnose the observed blocking events. The data used here were the pressure level 500 hPa heights (m) plotted on a 2.5o latitude by 2.5o longitude grid. These data are available in 6 h increments from 1 January 1948 to the present, and the 1200 UTC re-analyses were used primarily since these contain the most observations [33Wiedenmann JM, Lupo AR, Mokhov II, Tikhonova EA. The climatology of blocking anticyclones for the northern and southern hemispheres: Block intensity as a diagnostic. J Clim 2002; 15: 3459-73.
[http://dx.doi.org/10.1175/1520-0442(2002)015<3459:TCOBAF>2.0.CO;2] ].
2.2. Methods
In order to identify observed and ensemble model blocking events, the criteria [33Wiedenmann JM, Lupo AR, Mokhov II, Tikhonova EA. The climatology of blocking anticyclones for the northern and southern hemispheres: Block intensity as a diagnostic. J Clim 2002; 15: 3459-73.
[http://dx.doi.org/10.1175/1520-0442(2002)015<3459:TCOBAF>2.0.CO;2] ] was used and is described briefly here. This criterion stipulated that a blocking event must persist for at least five days and must satisfy the subjective [38Rex DF. Blocking action in the middle troposphere and its effect on regional climate II: The climatology of blocking action. Tellus 1950; 3: 275-301.] and objective [2Lejenas H, Okland H. Characteristics of northern hemisphere blocking as determined from a long time series of observational data. Tellus 1983; 35A: 350-62.
[http://dx.doi.org/10.1111/j.1600-0870.1983.tb00210.x] ] blocking criterion over a span of 30o longitude. More information about the criteria can be found in the study [8Lupo AR, Smith PJ. Climatological features of blocking anticyclones in the Northern Hemisphere. Tellus 1995; 47A: 439-56.
[http://dx.doi.org/10.3402/tellusa.v47i4.11527] , 33Wiedenmann JM, Lupo AR, Mokhov II, Tikhonova EA. The climatology of blocking anticyclones for the northern and southern hemispheres: Block intensity as a diagnostic. J Clim 2002; 15: 3459-73.
[http://dx.doi.org/10.1175/1520-0442(2002)015<3459:TCOBAF>2.0.CO;2] ]. In order to determine BI, the modified version [33Wiedenmann JM, Lupo AR, Mokhov II, Tikhonova EA. The climatology of blocking anticyclones for the northern and southern hemispheres: Block intensity as a diagnostic. J Clim 2002; 15: 3459-73.
[http://dx.doi.org/10.1175/1520-0442(2002)015<3459:TCOBAF>2.0.CO;2] ] first developed by the study [8Lupo AR, Smith PJ. Climatological features of blocking anticyclones in the Northern Hemisphere. Tellus 1995; 47A: 439-56.
[http://dx.doi.org/10.3402/tellusa.v47i4.11527] ] was used. This quantity is defined as:
 |
(1) |
where ZC is the daily block center 500 hPa height, RC is the representative mid-latitude flow contour. Then BI is averaged over the lifetime of the blocking event. RC is determined as the daily values of the lowest 500 hPa heights found along the trough axis upstream (ZU) and downstream (ZD) of the block along the inflection longitude and the formula for RC is:
 |
(2) |
BI has been used in many studies [18Lupo AR, Mokhov II, Akperov MG, Cherokulsky AV, Athar H. A dynamic analysis of the role of the planetary and synoptic scale in the summer of 2010 blocking episodes over the European part of Russia. Adv Meteorol 2012; 11.
[http://dx.doi.org/10.1155/2012/584257] ] and this quantity is proportional to the strength of mid-latitude height gradients has been demonstrated in the study [33Wiedenmann JM, Lupo AR, Mokhov II, Tikhonova EA. The climatology of blocking anticyclones for the northern and southern hemispheres: Block intensity as a diagnostic. J Clim 2002; 15: 3459-73.
[http://dx.doi.org/10.1175/1520-0442(2002)015<3459:TCOBAF>2.0.CO;2] ]. The expression (RC) is similar in form to that of a second-order one-dimensional Shapiro filter [16Lupo AR, Smith PJ. Planetary and Synoptic-Scale Interactions During the Life Cycle of a Mid-Latitude Blocking Anticyclone Over the North Atlantic. Tellus. Special Issue: The Life Cycles of Extratropical Cyclones 1995; 47A: 575-96., 40Shapiro R. Smoothing, filtering, and boundary effects. Rev Geophys 1970; 8: 359-87.
[http://dx.doi.org/10.1029/RG008i002p00359] ]. Also, BI is normally distributed and defined a strong (weak) block as those with a BI larger (smaller) than 4.3 (2.0) units [33Wiedenmann JM, Lupo AR, Mokhov II, Tikhonova EA. The climatology of blocking anticyclones for the northern and southern hemispheres: Block intensity as a diagnostic. J Clim 2002; 15: 3459-73.
[http://dx.doi.org/10.1175/1520-0442(2002)015<3459:TCOBAF>2.0.CO;2] ]. All other events between these values as moderate.
In order to evaluate the ensemble mean model performance, lead times up to ten days (240h) prior to the observed event were examined. As in the study [9Reynolds DD, Lupo AR, Jensen AD, Market PS. The predictability of Northern Hemisphere blocking using an ensemble mean forecast system. Electronic Conference on Atmospheric Science 2017 July 16-31; ], the results will be summarized by displaying the ten, seven, four, and one day, lead times following [9Reynolds DD, Lupo AR, Jensen AD, Market PS. The predictability of Northern Hemisphere blocking using an ensemble mean forecast system. Electronic Conference on Atmospheric Science 2017 July 16-31; ]. Also, the use of Integrated Regional Enstrophy (IRE) is discussed and compared this quantity to BI, which will be done here [9Reynolds DD, Lupo AR, Jensen AD, Market PS. The predictability of Northern Hemisphere blocking using an ensemble mean forecast system. Electronic Conference on Atmospheric Science 2017 July 16-31; ] and [10Matsueda M, Kyouda M, Toth Z, Tanaka HL, Tsuyuki T. Predictability of an atmospheric blocking event that occurred on 15 December 2005. Mon Weather Rev 2011; 139: 2455-70.
[http://dx.doi.org/10.1175/2010MWR3551.1] ]. IRE has been shown to be a useful diagnostic in identifying blocking and/or regime transition [11Hussain A, Lupo AR. Scale and stability analysis of blocking events from 2002-2004: A case study of an unusually persistent blocking event leading to a heat wave in the Gulf of Alaska during August 2004. Adv Meteor 2010; 15.
[http://dx.doi.org/10.1155/2010/610263] , 31Jensen AD, Lupo AR. Using enstrophy advection as a diagnostic to identify blocking regime transition. Q J R Meteorol Soc 2013; 139: 2-7.
[http://dx.doi.org/10.1002/qj.2248] , 41Jensen AD, Lupo AR. Using Enstrophy Based Diagnostics in an Ensemble for Two Blocking Events 2013; 7
[http://dx.doi.org/10.1155/2013/693859] -43Jensen AD, Lupo AR, Mokhov II, Akperov MG, Sun F. The dynamic character of Northern Hemisphere flow regimes in a near term climate change projection. Atmosphere 2018; 9(1): 27.
[http://dx.doi.org/10.3390/atmos9010027] ]. This diagnostic is a modified version of integrated enstrophy that was correlated with the sum of the positive Lyapunov Exponents in a quasi-barotropic flow [32Dymnikov VP, Kazantsev YV, Kharin VV. Information entropy and local Lyapunov exponents of barotropic atmospheric circulation. Izv, Atmos Ocean Phys 1992; 28: 425-32.]. They also described blocking as a quasi-stationary atmospheric state with quasi-barotropic structure. Lyapunov exponents measure the expansion or contraction of an initially infinitesimally small n-dimensional sphere, which becomes an n-dimensional ellipsoid in the phase space with time [34Jensen AD, Lupo AR, Mokhov II, Akperov MG, Reynolds DD. Integrated regional enstrophy and block intensity as a measure of Kolmogorov Entropy. Atmosphere 2017; 8(12): 237.
[http://dx.doi.org/10.3390/atmos8120237] ]. The study [11Hussain A, Lupo AR. Scale and stability analysis of blocking events from 2002-2004: A case study of an unusually persistent blocking event leading to a heat wave in the Gulf of Alaska during August 2004. Adv Meteor 2010; 15.
[http://dx.doi.org/10.1155/2010/610263] ] demonstrated that IRE over a large but finite region was similar to that over the entire NH. Then, this technique was used to determine the stability or predictability within a planetary-scale flow regime [11Hussain A, Lupo AR. Scale and stability analysis of blocking events from 2002-2004: A case study of an unusually persistent blocking event leading to a heat wave in the Gulf of Alaska during August 2004. Adv Meteor 2010; 15.
[http://dx.doi.org/10.1155/2010/610263] , 18Lupo AR, Mokhov II, Akperov MG, Cherokulsky AV, Athar H. A dynamic analysis of the role of the planetary and synoptic scale in the summer of 2010 blocking episodes over the European part of Russia. Adv Meteorol 2012; 11.
[http://dx.doi.org/10.1155/2012/584257] , 44Lupo AR, Mokhov II, Dostoglou S, Kunz AR, Burkhardt JP. The impact of the planetary scale on the decay of blocking and the use of phase diagrams and enstrophy as a diagnostic. Izv. Atms-Oc 2007; 43: 45-51.
[http://dx.doi.org/10.1134/S0001433807010057] ].
IRE is calculated as follows [18Lupo AR, Mokhov II, Akperov MG, Cherokulsky AV, Athar H. A dynamic analysis of the role of the planetary and synoptic scale in the summer of 2010 blocking episodes over the European part of Russia. Adv Meteorol 2012; 11.
[http://dx.doi.org/10.1155/2012/584257] ]:
 |
(3) |
where ζ is the vorticity or curl of the wind field, and λi is the sum of the positive Lyapunov exponents. IRE can be used as a measure of predictability [34Jensen AD, Lupo AR, Mokhov II, Akperov MG, Reynolds DD. Integrated regional enstrophy and block intensity as a measure of Kolmogorov Entropy. Atmosphere 2017; 8(12): 237.
[http://dx.doi.org/10.3390/atmos8120237] ] where higher (lower) values correspond to a lesser (greater) degree of predictability or possibly the transitioning of (a more stable) atmospheric flow [41Jensen AD, Lupo AR. Using Enstrophy Based Diagnostics in an Ensemble for Two Blocking Events 2013; 7
[http://dx.doi.org/10.1155/2013/693859] -43Jensen AD, Lupo AR, Mokhov II, Akperov MG, Sun F. The dynamic character of Northern Hemisphere flow regimes in a near term climate change projection. Atmosphere 2018; 9(1): 27.
[http://dx.doi.org/10.3390/atmos9010027] ]. In order to calculate this quantity, the geostrophic vorticity (ζg) was used and differentials were calculated using second-order finite differencing over a 20o latitude by 20o longitude grid box encompassing the center of the blocking event [11Hussain A, Lupo AR. Scale and stability analysis of blocking events from 2002-2004: A case study of an unusually persistent blocking event leading to a heat wave in the Gulf of Alaska during August 2004. Adv Meteor 2010; 15.
[http://dx.doi.org/10.1155/2010/610263] , 18Lupo AR, Mokhov II, Akperov MG, Cherokulsky AV, Athar H. A dynamic analysis of the role of the planetary and synoptic scale in the summer of 2010 blocking episodes over the European part of Russia. Adv Meteorol 2012; 11.
[http://dx.doi.org/10.1155/2012/584257] ].
In order to extend the work of [9Reynolds DD, Lupo AR, Jensen AD, Market PS. The predictability of Northern Hemisphere blocking using an ensemble mean forecast system. Electronic Conference on Atmospheric Science 2017 July 16-31; ], the relationship of IRE, BI, and block onset to traditional teleconnection indexes is examined. The Pacific North American (PNA) teleconnection [17Lupo AR, Bosart LF. An Analysis of a Relatively Rare Case of Continental Blocking. Q J R Meteorol Soc 1999; 125: 107-38.
[http://dx.doi.org/10.1002/qj.49712555308] , 45Wallace JM, Gutzler DS. Teleconnections in the geopotential height field during the Northern Hemisphere winter. Mon Weather Rev 1981; 109: 784-812.
[http://dx.doi.org/10.1175/1520-0493(1981)109<0784:TITGHF>2.0.CO;2] , 46Renken JD, Herman JJ, Bradshaw TR, Market PS, Lupo AR. The Utility of the Bering Sea and Typhoon Rules in Long Range Forecasting. Advances in Meteorology 2017.
[http://dx.doi.org/10.1155/2017/1765428] ]. is a west to east pattern of alternating height or pressure anomalies over the Pacific Ocean Region extending across North America. The North Atlantic Oscillation (NAO) [45Wallace JM, Gutzler DS. Teleconnections in the geopotential height field during the Northern Hemisphere winter. Mon Weather Rev 1981; 109: 784-812.
[http://dx.doi.org/10.1175/1520-0493(1981)109<0784:TITGHF>2.0.CO;2] ]. is a north-south surface pressure oscillation in the Atlantic Region and the fundamental dynamics are similar to that of the PNA pattern [46Renken JD, Herman JJ, Bradshaw TR, Market PS, Lupo AR. The Utility of the Bering Sea and Typhoon Rules in Long Range Forecasting. Advances in Meteorology 2017.
[http://dx.doi.org/10.1155/2017/1765428] -49Luo D, Gong T, Lupo AR. Dynamics of eddy-driven low-frequency dipole modes. Part II: Free mode characteristics of NAO and diagnostic study. J Atmos Sci 2019; 64: 29-51.]. The PNA and NAO also maybe the regional expression of vacillation [43Jensen AD, Lupo AR, Mokhov II, Akperov MG, Sun F. The dynamic character of Northern Hemisphere flow regimes in a near term climate change projection. Atmosphere 2018; 9(1): 27.
[http://dx.doi.org/10.3390/atmos9010027] ]. in the NH flow overall. The daily NAO and PNA indexes will indicate the phase Pacific and Atlantic Region troughing and ridging. The Arctic Oscillation (AO) is a teleconnection index related to the amplitude of the NH flow overall [50Lebedeva, MG, Lupo, AR, Chendev, YG, Krymskaya, OV, Solovyev AB. Changes in the atmospheric circulation conditions and regional climatic characteristics in two remote regions since the mid-20th century. Atmosphere 2019; 10: 23.]. Daily values of these indexes used here are obtained from the National Oceanic and Atmospheric Administration (NOAA) Climate Prediction Center (CPC - http://www.cpc.ncep.noaa.gov/products/).
3. SYNOPTIC DISCUSSION AND IRE
The work of [9Reynolds DD, Lupo AR, Jensen AD, Market PS. The predictability of Northern Hemisphere blocking using an ensemble mean forecast system. Electronic Conference on Atmospheric Science 2017 July 16-31; ] found 39 blocking events that occurred between 1 May 2016 and 30 April 2017 over the entire NH, including 19 for the Atlantic Region, 13 for the Pacific Region, and seven for the continental regions as defined by [33Wiedenmann JM, Lupo AR, Mokhov II, Tikhonova EA. The climatology of blocking anticyclones for the northern and southern hemispheres: Block intensity as a diagnostic. J Clim 2002; 15: 3459-73.
[http://dx.doi.org/10.1175/1520-0442(2002)015<3459:TCOBAF>2.0.CO;2] ]. Blocking events were selected to represent a diverse sample with respect to intensity, location, and seasonality within the NH [9Reynolds DD, Lupo AR, Jensen AD, Market PS. The predictability of Northern Hemisphere blocking using an ensemble mean forecast system. Electronic Conference on Atmospheric Science 2017 July 16-31; ]. Table 1 lists the blocking events that were studied in [9Reynolds DD, Lupo AR, Jensen AD, Market PS. The predictability of Northern Hemisphere blocking using an ensemble mean forecast system. Electronic Conference on Atmospheric Science 2017 July 16-31; ] and here. These blocking events will be referred to as they are abbreviated in Table 1. One of these (SCP) was also examined in [34Jensen AD, Lupo AR, Mokhov II, Akperov MG, Reynolds DD. Integrated regional enstrophy and block intensity as a measure of Kolmogorov Entropy. Atmosphere 2017; 8(12): 237.
[http://dx.doi.org/10.3390/atmos8120237] ].
3.1. Weak Warm Season Atlantic Region Block (WWA)
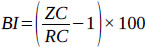
The first blocking event (WWA - Fig 1a ) was located within the Atlantic Region and persisted for 14.5 days [9Reynolds DD, Lupo AR, Jensen AD, Market PS. The predictability of Northern Hemisphere blocking using an ensemble mean forecast system. Electronic Conference on Atmospheric Science 2017 July 16-31; ]. Block onset was 1200 UTC 23 June 2016 and termination on 0000 UTC 8 July, 2016 (Table 1). The BI was 2.46 (Table 1) ranking as a moderate event close to the intensity of a typical warm season Atlantic Region event according to [33Wiedenmann JM, Lupo AR, Mokhov II, Tikhonova EA. The climatology of blocking anticyclones for the northern and southern hemispheres: Block intensity as a diagnostic. J Clim 2002; 15: 3459-73.
[http://dx.doi.org/10.1175/1520-0442(2002)015<3459:TCOBAF>2.0.CO;2] ]. The WWA block center of this event drifted to the east and termination occurred in the Ural Mountain region near 70° N. The BI (Fig. 2a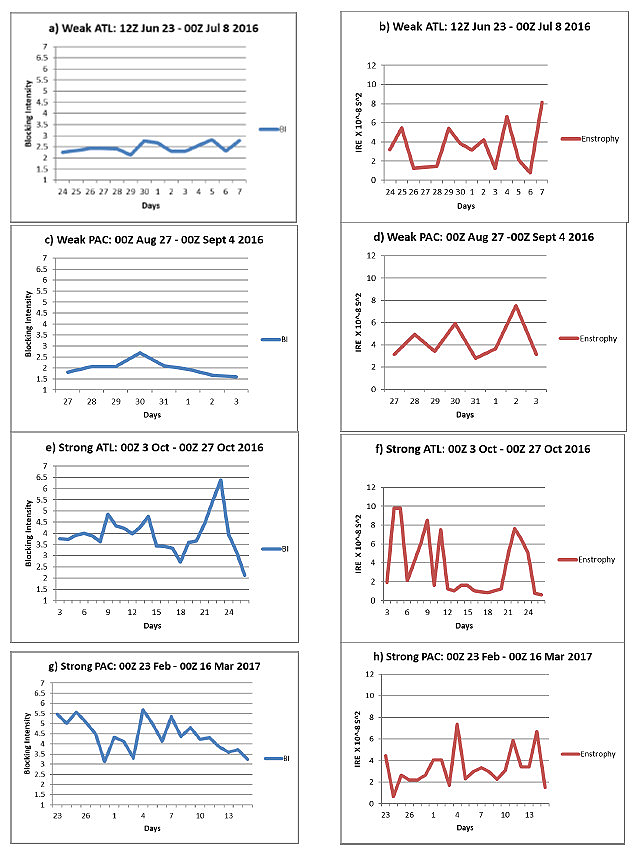 ) remained relatively steady over the block life cycle ranging from 2.14 - 2.82, but going through four increase and decrease cycles in association with upstream synoptic-scale cyclones [16Lupo AR, Smith PJ. Planetary and Synoptic-Scale Interactions During the Life Cycle of a Mid-Latitude Blocking Anticyclone Over the North Atlantic. Tellus. Special Issue: The Life Cycles of Extratropical Cyclones 1995; 47A: 575-96., 17Lupo AR, Bosart LF. An Analysis of a Relatively Rare Case of Continental Blocking. Q J R Meteorol Soc 1999; 125: 107-38.
[http://dx.doi.org/10.1002/qj.49712555308] , 51Lupo AR. A diagnosis of two blocking events that occurred simultaneously in the midlatitude Northern Hemisphere. Mon Wea Rev 1997; 1801-1823.
[http://dx.doi.org/10.1175/1520-0493(1997)125<1801:ADOTBE>2.0.CO;2] ]. Another block existed during the same time-period over continental Asia (25 June - 4 July 2016 - not shown), and a weak blocking event formed over the Pacific Region from 5 - 10 July, 2016- not shown).
The IRE (Fig. 2b) also increases during the WWA onset phase and behaves in a similar manner to BI throughout the block lifecycle. The correlation between the two quantities (Table 2) was 0.29, which was not statistically significant. Lastly, using the NCEP teleconnections website, the daily NAO Index was positive during block onset and remained positive for much of the block lifetime (mean value = 0.012), becoming strongly negative by termination. The daily AO Index was also positive (mean value = 0.791) during the lifetime of WWA of the block, becoming negative by termination. A negative correlation between BI (Table 3) during the lifecycle of this blocking event and NAO (-0.47) and BI and AO (-0.61) was significant at the 90% and 95% confidence level, respectively. IRE correlated negatively with the AO (-0.48) as well, and this was significant at the 90% confidence level. The NAO and AO correlated at 0.79, which was significant at the 99% confidence level, similar to the long-term study of [50Lebedeva, MG, Lupo, AR, Chendev, YG, Krymskaya, OV, Solovyev AB. Changes in the atmospheric circulation conditions and regional climatic characteristics in two remote regions since the mid-20th century. Atmosphere 2019; 10: 23.]. The implication of this analysis will be discussed below.
Correlation of IRE and BI for each event from Table 1 and for a lag of BI with respect to IRE by 24-h increments out to 72-h. WA: Weak Atlantic, WP: Weak Pacific, SA: Strong Atlantic, SP: Strong Pacific, *best correlation, and +, ++, and +++ is correlation significant at least at the 90%, 95%, and 99% confidence level, respectively.

3.2. Weak Warm Season Pacific Region Block (WWP)
The second blocking event (WWP) developed over the Pacific Region [9Reynolds DD, Lupo AR, Jensen AD, Market PS. The predictability of Northern Hemisphere blocking using an ensemble mean forecast system. Electronic Conference on Atmospheric Science 2017 July 16-31; ] and persisted for eight days (Fig. 1b). The onset occurred at 0000 UTC 27 August, 2016 and terminated on 0000 UTC 4 September, 2016 (Table 1). This blocking event was considered a weak warm-season event (BI = 1.99) (Table 1), however, this is typical for NH or Pacific Region blocking events. The study of [33Wiedenmann JM, Lupo AR, Mokhov II, Tikhonova EA. The climatology of blocking anticyclones for the northern and southern hemispheres: Block intensity as a diagnostic. J Clim 2002; 15: 3459-73.
[http://dx.doi.org/10.1175/1520-0442(2002)015<3459:TCOBAF>2.0.CO;2] ] found that cold season and oceanic region blocks were stronger than warm-season or continental blocking events in general. This blocking event was nearly stationary, drifting slowly poleward within the western Pacific Region throughout the lifecycle. The blocking BI (Fig. 2c) changed some as well but was similar in strength at onset (BI = 1.81) and termination (BI = 1.60). The maximum BI was 2.69 occurring near the middle of its lifecycle (31 August, 2016).
During the WWP block lifecycle, the IRE (Fig. 2d) was shown also to be steady and the correlation between BI and IRE was 0.15 (Table 2) [9Reynolds DD, Lupo AR, Jensen AD, Market PS. The predictability of Northern Hemisphere blocking using an ensemble mean forecast system. Electronic Conference on Atmospheric Science 2017 July 16-31; ]. This correlation was not statistically significant. The WWP event persisted within a positive PNA (PNA = 1.064 time) and AO (AO = 0.662) Index regime. The block lifecycle was bookended by negative PNA index values. The daily AO Index was strongly positive from 31 July to about 20 September indicating more zonal NH flow. However, for WWP the AO and PNA correlated negatively (-0.83) and in [50]. Due to the small sample size, this was not significant at standard levels. Table 3 shows that BI and IRE did not correlate at standard levels of significance to the teleconnection indexes.
3.3. Strong Cold Season Atlantic Region Block (SCA)
A strong blocking event (SCA - Fig. 1c) dominated the eastern Atlantic Region for 24 days during October 2016 [9Reynolds DD, Lupo AR, Jensen AD, Market PS. The predictability of Northern Hemisphere blocking using an ensemble mean forecast system. Electronic Conference on Atmospheric Science 2017 July 16-31; ]. The blocking event onset at 0000 UTC 3 October, 2016 and terminated on 0000 UTC 27 October 2016 (Table 1). The BI was 3.96 (Table 1), which is a strong moderate event typical for a fall or winter occurring in the NH or Atlantic Region event [33Wiedenmann JM, Lupo AR, Mokhov II, Tikhonova EA. The climatology of blocking anticyclones for the northern and southern hemispheres: Block intensity as a diagnostic. J Clim 2002; 15: 3459-73.
[http://dx.doi.org/10.1175/1520-0442(2002)015<3459:TCOBAF>2.0.CO;2] ]. This was the third event examined and, Like the WWA event, the SCA event drifted eastward and slightly poleward over the course of the lifecycle terminating near the Urals. The BI (Fig. 2e) diagnostic showed similar behavior to the previously discussed events as the SCA went through three periods of strengthening after onset [16Lupo AR, Smith PJ. Planetary and Synoptic-Scale Interactions During the Life Cycle of a Mid-Latitude Blocking Anticyclone Over the North Atlantic. Tellus. Special Issue: The Life Cycles of Extratropical Cyclones 1995; 47A: 575-96., 17Lupo AR, Bosart LF. An Analysis of a Relatively Rare Case of Continental Blocking. Q J R Meteorol Soc 1999; 125: 107-38.
[http://dx.doi.org/10.1002/qj.49712555308] ]. The SCA ranged from BI = 2.72 on 18 October to BI = 6.38 on 23 October [9Reynolds DD, Lupo AR, Jensen AD, Market PS. The predictability of Northern Hemisphere blocking using an ensemble mean forecast system. Electronic Conference on Atmospheric Science 2017 July 16-31; ].
The IRE (Fig. 2f) behaved similarly to the BI for the SCA [9Reynolds DD, Lupo AR, Jensen AD, Market PS. The predictability of Northern Hemisphere blocking using an ensemble mean forecast system. Electronic Conference on Atmospheric Science 2017 July 16-31; ] and the correlation between the two-time series was 0.49, a value significant at the 99% confidence level (Table 2). The IRE shows a maximum at the onset of SCA and towards decay. This suggested a flow regime transition near the time of termination [41Jensen AD, Lupo AR. Using Enstrophy Based Diagnostics in an Ensemble for Two Blocking Events 2013; 7
[http://dx.doi.org/10.1155/2013/693859] , 42Jensen AD, Lupo AR. The Role of Deformation and Other Quantities in an Equation for Enstrophy as Applied to Atmospheric Blocking. Dyn Atmos Oc 2014.
[http://dx.doi.org/10.1016/j.dynatmoce.2014.03.004] ]. This blocking event persisted through a prolonged period of positive daily NAO Index values as 30 out of 35 days from 29 September - 2 November 2016 were a positive value. The mean NAO and AO Index values for this blocking event were 0.166 and -2.080, respectively, and correlated positively (0.34) at the 90% confidence level. Table 3 demonstrates that for the SCA, BI and IRE correlate with the primary teleconnection indexes in the same manner as the WWA, except that the confidence levels were higher.
 |
Fig. (2) The a), c), e), and g) BI (no units) and b), d), f), h) IRE (x 10-8 s-2) for the WWA, WWP, SCA, and SCP blocking events, respectively. |
3.4. Strong Cold Season Pacific Region Block (SCP)
The fourth blocking event examined was a strong Pacific Region event (SCP - Fig. 1d) was first identified in 0000 UTC 23 February 2017 near 50o N 160o W within the Bering Sea Region (Table 1). The SCP was studied by [9Reynolds DD, Lupo AR, Jensen AD, Market PS. The predictability of Northern Hemisphere blocking using an ensemble mean forecast system. Electronic Conference on Atmospheric Science 2017 July 16-31; ] and [34Jensen AD, Lupo AR, Mokhov II, Akperov MG, Reynolds DD. Integrated regional enstrophy and block intensity as a measure of Kolmogorov Entropy. Atmosphere 2017; 8(12): 237.
[http://dx.doi.org/10.3390/atmos8120237] ] and persisted for 21 days, remaining stationary before terminating near the dateline on 0000 UTC 16 March, 2017 (Table 1). The SCP was the strongest event studied here (BI = 4.51). The BI for the SCP event ranged between 3.13 on 28 February 2017 and 5.69 on 4 March, 2017 (Fig. 2g). The mid-lifecycle peak in BI was associated with strong upstream cyclone development and BI then decreased steadily until termination. On 4 March, 2017, a second (simultaneous) event developed over the Atlantic region (not shown) and was also strong. In the NH [33Wiedenmann JM, Lupo AR, Mokhov II, Tikhonova EA. The climatology of blocking anticyclones for the northern and southern hemispheres: Block intensity as a diagnostic. J Clim 2002; 15: 3459-73.
[http://dx.doi.org/10.1175/1520-0442(2002)015<3459:TCOBAF>2.0.CO;2] ] observed that simultaneously occurring blocking events are generally strong.
The IRE was steady throughout the SCP block lifecycle (Fig. 2h) [9Reynolds DD, Lupo AR, Jensen AD, Market PS. The predictability of Northern Hemisphere blocking using an ensemble mean forecast system. Electronic Conference on Atmospheric Science 2017 July 16-31; ], [34Jensen AD, Lupo AR, Mokhov II, Akperov MG, Reynolds DD. Integrated regional enstrophy and block intensity as a measure of Kolmogorov Entropy. Atmosphere 2017; 8(12): 237.
[http://dx.doi.org/10.3390/atmos8120237] ], but peaked at the same time that BI was a maximum. The correlation between these two variables was about 0.16 (Table 2), and this correlation is not statistically significant. This event persisted within a strongly negative (positive) PNA (AO) Index regime (PNA = -0.669 [AO = 1.45]). The SCP event underwent decay as the PNA index transitioned to a positive value [34Jensen AD, Lupo AR, Mokhov II, Akperov MG, Reynolds DD. Integrated regional enstrophy and block intensity as a measure of Kolmogorov Entropy. Atmosphere 2017; 8(12): 237.
[http://dx.doi.org/10.3390/atmos8120237] ]. This block also persisted through a long period of positive AO values, with only a brief excursion into negative values from 5 March to 9 March [34Jensen AD, Lupo AR, Mokhov II, Akperov MG, Reynolds DD. Integrated regional enstrophy and block intensity as a measure of Kolmogorov Entropy. Atmosphere 2017; 8(12): 237.
[http://dx.doi.org/10.3390/atmos8120237] ]. Like the WWA and SCA events, the BI and IRE for this event correlated to the relevant teleconnection indexes as did the WWP event (Table 3).
4. DISCUSSION
The study of [16Lupo AR, Smith PJ. Planetary and Synoptic-Scale Interactions During the Life Cycle of a Mid-Latitude Blocking Anticyclone Over the North Atlantic. Tellus. Special Issue: The Life Cycles of Extratropical Cyclones 1995; 47A: 575-96.] and subsequent papers showed that the onset of every blocking event is accompanied by a developing surface cyclone and upper air short wave located upstream of a large-scale ridge. They also noted that the intensification of an associated upper-level jet maximum on the upstream flank of the incipient blocking event strengthens the transport of anticyclonic vorticity into the developing event. Then [17Lupo AR, Bosart LF. An Analysis of a Relatively Rare Case of Continental Blocking. Q J R Meteorol Soc 1999; 125: 107-38.
[http://dx.doi.org/10.1002/qj.49712555308] ] demonstrated that the ideal phase relationship between the developing upstream low and blocking event is about 10o-50o longitude. Each event studied here [9Reynolds DD, Lupo AR, Jensen AD, Market PS. The predictability of Northern Hemisphere blocking using an ensemble mean forecast system. Electronic Conference on Atmospheric Science 2017 July 16-31; ] follows the same development mechanism of [16Lupo AR, Smith PJ. Planetary and Synoptic-Scale Interactions During the Life Cycle of a Mid-Latitude Blocking Anticyclone Over the North Atlantic. Tellus. Special Issue: The Life Cycles of Extratropical Cyclones 1995; 47A: 575-96.], and the WWP serves as an example the WWP from blocking event two (weak Pacific Region block is shown in Fig. (3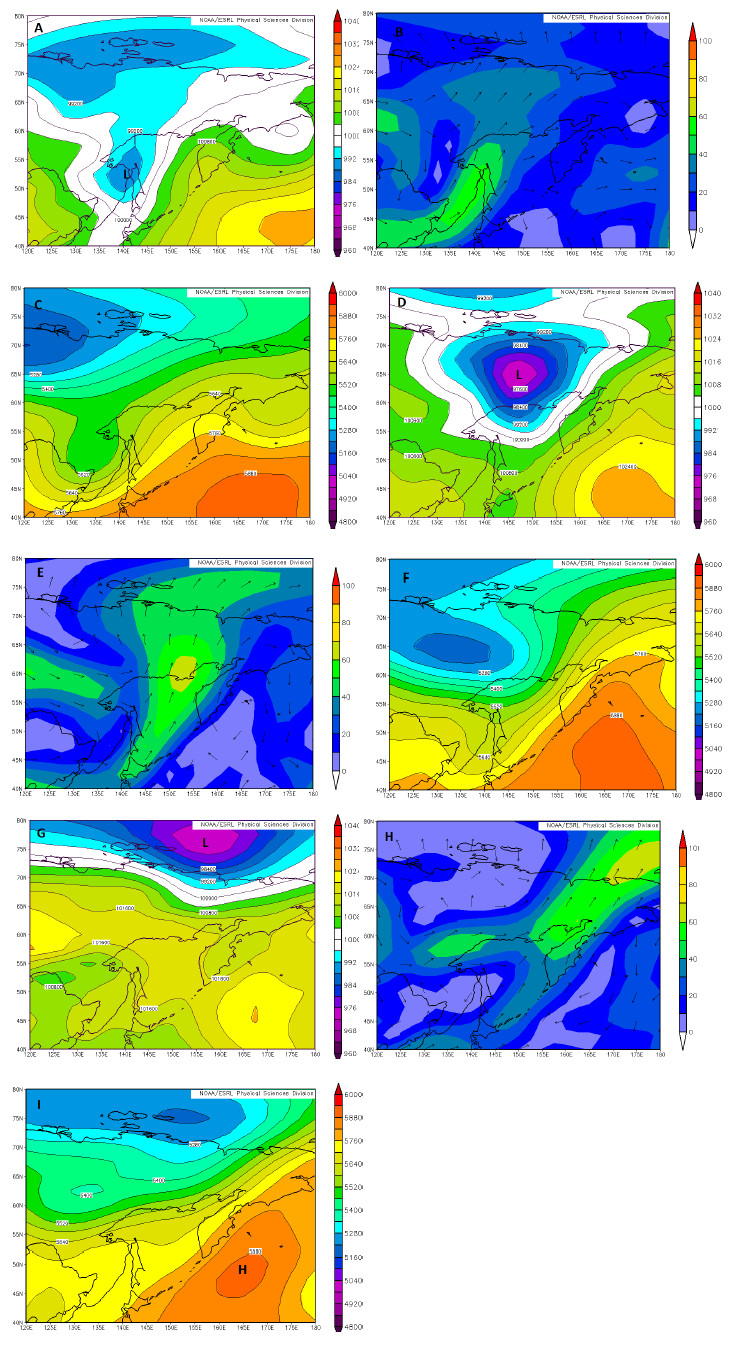 ).
).
At 1200 UTC 25 August (Fig. 3a), a surface low with a central pressure of 990 hPa was located near Manchuria and Sakhalin Island (52.5o N 140o E). This time was the start of a 24 h period of rapid (but not explosive) development. By 1200 UTC 26 August (Fig. 3d), the cyclone central pressure was at 973 hPa. This represented a 17 hPa decrease in central pressure over 24 h, a deepening rate of 0.75 Bergerons. The explosive development rate is 24 hPa 24 h-1 at 60o N as defined by [52Sanders F, Gyakum JR. Synoptic-dynamic climatology of the “bomb”. Mon Weather Rev 1980; 108: 1577-89.
[http://dx.doi.org/10.1175/1520-0493(1980)108<1589:SDCOT>2.0.CO;2] ]. At the cyclone’s latitude, a decrease of 22.7 hPa in 24 h would have been the criterion for explosive development. The rapid cyclone deepening occurred roughly 20-25 degrees upstream of the incipient block onset (Fig. 3i), consistent with [9Reynolds DD, Lupo AR, Jensen AD, Market PS. The predictability of Northern Hemisphere blocking using an ensemble mean forecast system. Electronic Conference on Atmospheric Science 2017 July 16-31; , 17Lupo AR, Bosart LF. An Analysis of a Relatively Rare Case of Continental Blocking. Q J R Meteorol Soc 1999; 125: 107-38.
[http://dx.doi.org/10.1002/qj.49712555308] ].
As in [9Reynolds DD, Lupo AR, Jensen AD, Market PS. The predictability of Northern Hemisphere blocking using an ensemble mean forecast system. Electronic Conference on Atmospheric Science 2017 July 16-31; ] (Fig. 3b), the cyclone was located in the poleward exit region of a jet maximum located near the base of the upper-air trough at this time. Over the 24 h development period (Fig. 3e), the wind maximum on the block upstream flank strengthens as evidenced by the increases in the vector wind components [9Reynolds DD, Lupo AR, Jensen AD, Market PS. The predictability of Northern Hemisphere blocking using an ensemble mean forecast system. Electronic Conference on Atmospheric Science 2017 July 16-31; ]. Additionally, at 500 hPa (Fig. 3c,f), a short wave trough-ridge couplet in the large-scale wave amplifies in scale and phases with the large-scale hemispheric wave pattern. Fig. (2d) demonstrates that IRE increased during the early part of the block lifecycle along with the BI (Fig. 2c) [9Reynolds DD, Lupo AR, Jensen AD, Market PS. The predictability of Northern Hemisphere blocking using an ensemble mean forecast system. Electronic Conference on Atmospheric Science 2017 July 16-31; ]. Thus, a relative maximum for both variables occurred following the period of rapid upstream cyclone deepening [9Reynolds DD, Lupo AR, Jensen AD, Market PS. The predictability of Northern Hemisphere blocking using an ensemble mean forecast system. Electronic Conference on Atmospheric Science 2017 July 16-31; ], [34Jensen AD, Lupo AR, Mokhov II, Akperov MG, Reynolds DD. Integrated regional enstrophy and block intensity as a measure of Kolmogorov Entropy. Atmosphere 2017; 8(12): 237.
[http://dx.doi.org/10.3390/atmos8120237] , 51Lupo AR. A diagnosis of two blocking events that occurred simultaneously in the midlatitude Northern Hemisphere. Mon Wea Rev 1997; 1801-1823.
[http://dx.doi.org/10.1175/1520-0493(1997)125<1801:ADOTBE>2.0.CO;2] ].
The post-development IRE maximum may be associated with a maximum in the synoptic-scale component of the 500 hPa height field as shown by [18Lupo AR, Mokhov II, Akperov MG, Cherokulsky AV, Athar H. A dynamic analysis of the role of the planetary and synoptic scale in the summer of 2010 blocking episodes over the European part of Russia. Adv Meteorol 2012; 11.
[http://dx.doi.org/10.1155/2012/584257] ] for the July 2010 western Russia blocking event. These maxima are likely associated with the deepening synoptic-scale cyclone as shown by [9Reynolds DD, Lupo AR, Jensen AD, Market PS. The predictability of Northern Hemisphere blocking using an ensemble mean forecast system. Electronic Conference on Atmospheric Science 2017 July 16-31; ] and [51Lupo AR. A diagnosis of two blocking events that occurred simultaneously in the midlatitude Northern Hemisphere. Mon Wea Rev 1997; 1801-1823.
[http://dx.doi.org/10.1175/1520-0493(1997)125<1801:ADOTBE>2.0.CO;2] ]. Then, the BI maxima may be expected to occur near the time of the IRE maxima as in [34Jensen AD, Lupo AR, Mokhov II, Akperov MG, Reynolds DD. Integrated regional enstrophy and block intensity as a measure of Kolmogorov Entropy. Atmosphere 2017; 8(12): 237.
[http://dx.doi.org/10.3390/atmos8120237] ]. However, the question was asked as to whether a maximum in IRE leads or lags a maximum in BI. Alternatively, do these variables attain a maximum value together?
In order to test these questions, a correlation analysis was performed for all four blocking events with and without a time lag of each variable for up to 72 hours as in [9Reynolds DD, Lupo AR, Jensen AD, Market PS. The predictability of Northern Hemisphere blocking using an ensemble mean forecast system. Electronic Conference on Atmospheric Science 2017 July 16-31; , 34Jensen AD, Lupo AR, Mokhov II, Akperov MG, Reynolds DD. Integrated regional enstrophy and block intensity as a measure of Kolmogorov Entropy. Atmosphere 2017; 8(12): 237.
[http://dx.doi.org/10.3390/atmos8120237] ] (Table 2). There were no positive correlations when BI (based on height gradient) led IRE (based on vorticity). However, when the IRE maximum leads the BI maximum, higher positive correlations were observed for each blocking event if the time series were shifted by up to 72 hours. Table 2 shows that for three of the four blocking events, the highest lag-correlation occurred 24 (WWA), 48 (WWP), or 72 (SCP) hours after rapid development. Only for the SCA event three (strong Atlantic Region) did these maxima occur together. A similar IRE - BI lag (24 h) was found for the onset of a winter season blocking event in 2014 studied in [34Jensen AD, Lupo AR, Mokhov II, Akperov MG, Reynolds DD. Integrated regional enstrophy and block intensity as a measure of Kolmogorov Entropy. Atmosphere 2017; 8(12): 237.
[http://dx.doi.org/10.3390/atmos8120237] ] (but not included here). Also, for all of the longer-lived events (all but the WWP event), the highest IRE - BI lag-correlations were significant at the 90% confidence level or greater. This was true for the winter 2014 block as well [34Jensen AD, Lupo AR, Mokhov II, Akperov MG, Reynolds DD. Integrated regional enstrophy and block intensity as a measure of Kolmogorov Entropy. Atmosphere 2017; 8(12): 237.
[http://dx.doi.org/10.3390/atmos8120237] ].

The deepening rates of the upstream cyclones were 0.25, 0.75, 1.10, and 1.05 Bergerons for the WWA, WWP, SCA, and SCP blocking events, respectively. The period of rapid deepening began 96, 36, 48, and 60 hours, respectively, for each blocking event. Thus, the time period from the start of rapid cyclogenesis to maximum IRE - BI lag correlation was 120, 84, 48, and 132 hours, respectively. Thus, the process of rapid cyclone development, IRE increases during block development, and block BI rises for the first three events was quicker for each of the first three events commensurate with the strength of the rapid cyclone development. This is consistent with many studies [52Sanders F, Gyakum JR. Synoptic-dynamic climatology of the “bomb”. Mon Weather Rev 1980; 108: 1577-89.
[http://dx.doi.org/10.1175/1520-0493(1980)108<1589:SDCOT>2.0.CO;2] ]. that demonstrate rapidly developing cyclones mature in a shorter time span.
The work of [8Lupo AR, Smith PJ. Climatological features of blocking anticyclones in the Northern Hemisphere. Tellus 1995; 47A: 439-56.
[http://dx.doi.org/10.3402/tellusa.v47i4.11527] ] found that a stronger upstream precursor cyclone correlated with a stronger more persistent blocking event. These results may provide a dynamic background for the correlations found in [8Lupo AR, Smith PJ. Climatological features of blocking anticyclones in the Northern Hemisphere. Tellus 1995; 47A: 439-56.
[http://dx.doi.org/10.3402/tellusa.v47i4.11527] ]. The only event that did not follow the sequence above with less time between the start of rapid cyclogenesis to maximum IRE- BI lag correlation was the SCP event. For the other three block onsets discussed, there was clearly one rapidly deepening cyclone associated with block onset. For the SCP event, there were three successive explosively developing cyclones, which occurred within five days of block onset. In the discussion above, the explosive cyclone closest to block onset was analyzed.
The winter 2014 Pacific Region event analyzed by [34Jensen AD, Lupo AR, Mokhov II, Akperov MG, Reynolds DD. Integrated regional enstrophy and block intensity as a measure of Kolmogorov Entropy. Atmosphere 2017; 8(12): 237.
[http://dx.doi.org/10.3390/atmos8120237] ], however, followed a sequence similar to that of the SCP event. A precursor cyclone began rapid development 72 hours before block onset at a rate of 1.46 Bergerons, and the maximum IRE-BI lag occurred 48 h after onset for a total time of 120 hours. Like the SCP event, the precursor cyclone was the last of a series of three explosive cyclones occurring five days before block onset. More case studies should be examined to determine whether the rate of deepening for precursor cyclones is correlated to a short time to maximum IRE-BI lag-correlation, or if the number of precursor cyclones impacts the process. No other studies have examined these questions previously.
The study of [51Lupo AR. A diagnosis of two blocking events that occurred simultaneously in the midlatitude Northern Hemisphere. Mon Wea Rev 1997; 1801-1823.
[http://dx.doi.org/10.1175/1520-0493(1997)125<1801:ADOTBE>2.0.CO;2] ] found that rapid block center point block height rises and BI increases occurred following block onset. Thus, the block formation paradigm of [51Lupo AR. A diagnosis of two blocking events that occurred simultaneously in the midlatitude Northern Hemisphere. Mon Wea Rev 1997; 1801-1823.
[http://dx.doi.org/10.1175/1520-0493(1997)125<1801:ADOTBE>2.0.CO;2] ] can be modified as in [9Reynolds DD, Lupo AR, Jensen AD, Market PS. The predictability of Northern Hemisphere blocking using an ensemble mean forecast system. Electronic Conference on Atmospheric Science 2017 July 16-31; ] and hereby stating that first upstream cyclone deepening occurs, and then a maximum in IRE will occur after the period of the rapid upstream cyclone development begins and at or following block onset. Then, a maximum in BI occurs at or following the peak in IRE. Here, we examined the phase relationship between the upstream cyclones and the BI lag. There is no association between the location of the upstream cyclone and the block onset.
Additionally, we examined the relationship between each blocking event and the local and NH large-scale flow regimes or teleconnections. Past studies [11Hussain A, Lupo AR. Scale and stability analysis of blocking events from 2002-2004: A case study of an unusually persistent blocking event leading to a heat wave in the Gulf of Alaska during August 2004. Adv Meteor 2010; 15.
[http://dx.doi.org/10.1155/2010/610263] , 31Jensen AD, Lupo AR. Using enstrophy advection as a diagnostic to identify blocking regime transition. Q J R Meteorol Soc 2013; 139: 2-7.
[http://dx.doi.org/10.1002/qj.2248] , 51Lupo AR. A diagnosis of two blocking events that occurred simultaneously in the midlatitude Northern Hemisphere. Mon Wea Rev 1997; 1801-1823.
[http://dx.doi.org/10.1175/1520-0493(1997)125<1801:ADOTBE>2.0.CO;2] , 53Haines K. Holland, AJ vacillation cycles and blocking in a channel. Q J R Meteorol Soc 1998; 124: 873-97.
[http://dx.doi.org/10.1002/qj.49712454711] ] (and references therein) suggested that blocking events generally do not survive the transition from one quasi-stable large-scale flow regime to another, although it is occasionally possible if the blocking event is undergoing intensification at that time [34Jensen AD, Lupo AR, Mokhov II, Akperov MG, Reynolds DD. Integrated regional enstrophy and block intensity as a measure of Kolmogorov Entropy. Atmosphere 2017; 8(12): 237.
[http://dx.doi.org/10.3390/atmos8120237] ]. Thus, the annual number of flow regime transitions and blocking events may not match [22Jensen AD, Lupo AR, Mokhov II, Akperov MG, Sun F. The dynamic character of Northern Hemisphere flow regimes in a near term climate change projection. Atmosphere 2018; 9(1): 27.
[http://dx.doi.org/10.3390/atmos9010027] ]. However, all four blocking events studied here experienced onset and/or decay within three to five days of a phase change in the PNA or NAO. Although for particularly long-lived PNA, NAO, or AO episodes, the onset or decay of these events was even further away from a change in flow regime (e.g. decay of the SCA event). None of the four blocking events survived local or hemispheric flow regime transitions.
Finally, correlation analysis shows that the relationship between blocking event BI and IRE correlated negatively to the NAO and AO (which correlated positively with each other). These results would be consistent with [50] for the Atlantic Region teleconnections. The flow regime changes as indicated by the teleconnection indexes occurring near the time of rapidly developing cyclones along with changes in regional IRE and block onset found in [9Reynolds DD, Lupo AR, Jensen AD, Market PS. The predictability of Northern Hemisphere blocking using an ensemble mean forecast system. Electronic Conference on Atmospheric Science 2017 July 16-31; ] (and here) are consistent with the well-known paradigm of flow regime transition precursor events [54Michel C, Rivière G. The link between Rossby wave breakings and weather regime transitions. J Atmos Sci 2011; 68: 1730-48.
[http://dx.doi.org/10.1175/2011JAS3635.1] , 55Luo D, Lupo AR, Wan H. Dynamics of eddy-driven low-frequency dipole modes. Part I: A simple model of North Atlantic Oscillations. J Atmos Sci 2007; 64: 29-51.
[http://dx.doi.org/10.1175/JAS3820.1] ]. The results here are also similar for the Pacific Region [56Huang W, Chen R, Wang B, Wright JS, Yang Z, Ma W. Potential vorticity regimes over East Asia during winter. J Geophys Res Atmos 2016; 122.], but the teleconnection correlations to IRE were not as strong for this region. At least for the Atlantic Region, IRE in conjunction with AO regime changes indicate NAO regime changes.
4.1. Ensemble Forecasts
In order to examine the ability of the NCEP GEFS ensemble to predict block characteristics such as onset, location, duration, and the BI, the comparisons were made beginning with a 10-day forecast lead-time and tracking the model forecast to the one day forecast before the observed onset time (Table 4). As stated in section two, the ensemble mean was used since this generally produced the best comparison for observed blocking IRE character as shown in [41Jensen AD, Lupo AR. Using Enstrophy Based Diagnostics in an Ensemble for Two Blocking Events 2013; 7
[http://dx.doi.org/10.1155/2013/693859] ]. In order to summarize the results, Table 4 shows the results of the 10-day, seven-day, four-day, and one-day forecasts [9Reynolds DD, Lupo AR, Jensen AD, Market PS. The predictability of Northern Hemisphere blocking using an ensemble mean forecast system. Electronic Conference on Atmospheric Science 2017 July 16-31; ]. The GEFS model BI forecast was compared only to observed BI for days that blocking existed in the model forecast. Also, Table 4 demonstrated that none of the blocking events were forecast by the GEFS ensemble 10 days before the observed onset. However, the WWA, WWP, SCA, SCP blocking event one, two, three, and four did appear in the GEFS mean ensemble model forecast with a lead time of days nine, eight, four, and four days, respectively.
4.1.1. Seven-day Lead Forecast
For the seven-day GEFS models forecasts (Table 4), the two weaker warm-season events were anticipated well [9Reynolds DD, Lupo AR, Jensen AD, Market PS. The predictability of Northern Hemisphere blocking using an ensemble mean forecast system. Electronic Conference on Atmospheric Science 2017 July 16-31; ]. The onset of the WWA event was forecast well for the entire seven-day period before the observed onset (Table 4), however, the location of onset for this event was 10 degrees longitude to the east (not shown). The GEFS mean ensemble model forecast for the WWA blocking event verified over the final four days of the period. The BI was under-forecast by more than 50%, a difference of 1.19 BI units. The climatological BI standard deviation is 1.05 [33Wiedenmann JM, Lupo AR, Mokhov II, Tikhonova EA. The climatology of blocking anticyclones for the northern and southern hemispheres: Block intensity as a diagnostic. J Clim 2002; 15: 3459-73.
[http://dx.doi.org/10.1175/1520-0442(2002)015<3459:TCOBAF>2.0.CO;2] ]. For the WWP blocking event, a strong ridge was placed in the proper location (165o E) by the GEFS mean ensemble model and a block was identified in the model for only one day at the end of the 10-day forecast period. This was three days following the observed onset. Also, the BI for this one day block in the GEFS ensemble mean was lower than that of the observed event (Table 4 - 0.95 BI). For the two strong cold season cases, while no block was generated in the GEFS ensemble model with a seven-day lead time, large-scale ridging was located close to where blocking was eventually observed [9Reynolds DD, Lupo AR, Jensen AD, Market PS. The predictability of Northern Hemisphere blocking using an ensemble mean forecast system. Electronic Conference on Atmospheric Science 2017 July 16-31; ].
4.1.2. Four-day Lead Forecast
The four-day GEFS mean ensemble model forecasts were similar in many respects for all four blocking events [9Reynolds DD, Lupo AR, Jensen AD, Market PS. The predictability of Northern Hemisphere blocking using an ensemble mean forecast system. Electronic Conference on Atmospheric Science 2017 July 16-31; ]. For each case, the ensemble model block did develop at the same longitude as the observed block onset, or within 10 degrees the observed block center. Also, the four model blocking events persisted for four to six days into the GEFS 10-day forecast period (Table 4) but did not exist as a blocking event by the end of the 240 hour forecast period. Additionally, the GEFS mean ensemble model BI was under-forecast in all four cases, although the degree of BI under-forecast varied considerably from 0.36 BI units (16.5%) for the WWP block case to 1.71 BI units (37%) for the SCP case (Table 4). In terms of a percentage, the WWA blocking event showed the greatest ensemble model BI under-forecast at 43%. For all four events, the GEFS mean ensemble blocking event BI was similar to the observed event BI for the first two days (not shown). However, by the end of model forecast, the modeled BI diminished greatly and was under-forecast from observed in some cases by more than two BI units. Additionally, the timing of the GEFS mean ensemble forecast block onsets showed some variance from the observed (Table 4), as well. For the WWA and SCP blocking events, the GEFS ensemble model onset occurred on the same day as the observed event [9Reynolds DD, Lupo AR, Jensen AD, Market PS. The predictability of Northern Hemisphere blocking using an ensemble mean forecast system. Electronic Conference on Atmospheric Science 2017 July 16-31; ]. For the WWP and SCA cases, the GEFS ensemble model block onset was 24 h and 48 hours later than observed, respectively.
4.1.3. One-day Lead Forecast
At 24 h before observed block onset, each of the GEFS mean ensemble blocking events were forecast well in terms of the timing of the onset (Table 4). The location of the model block onset was at the locations of the observed onset (Table 1) [9Reynolds DD, Lupo AR, Jensen AD, Market PS. The predictability of Northern Hemisphere blocking using an ensemble mean forecast system. Electronic Conference on Atmospheric Science 2017 July 16-31; ]. Only for the SCA block was the GEFS ensemble model onset 24 h later than the observed blocking event. Since the GEFS mean model ensembles were examined in 24 h increments, the actual difference in model-observed onset may be only approximately 12 h. Also, there was some improvement in the GEFS model forecast BI for the two weak warm-season events when compared to the four-day forecasts, however, for the two strong cold season events the improvement was more dramatic. For the WWA blocking case, the BI under-forecast improved to 39% less than observed, while the SCP block ensemble model forecast BI is only 9% less than observed.
Fig. (4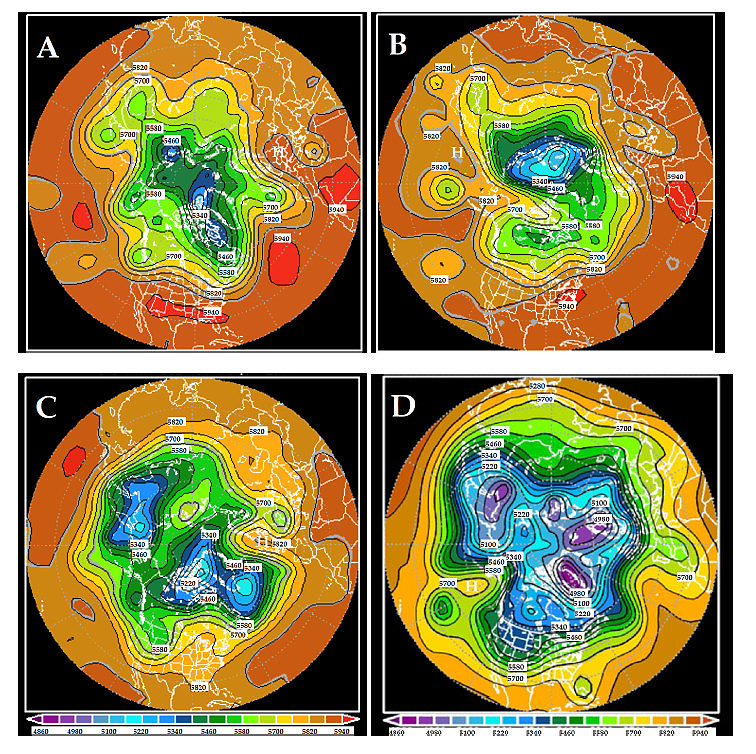 ) shows the GEFS mean ensemble model blocking events at a similar time (12 h earlier) to the observed blocking events in Fig. (1) [9Reynolds DD, Lupo AR, Jensen AD, Market PS. The predictability of Northern Hemisphere blocking using an ensemble mean forecast system. Electronic Conference on Atmospheric Science 2017 July 16-31; ] and the BI values are included in the caption. The GEFS mean ensemble model events look very similar to the observed events, and given that these are 48 h model forecasts the model BI values are close to the observed BI. The model BI is provided in Figs. 1 and 4, and for the WWA, WWP, and SCP blocking events, the observed blocking events are still stronger by 0.27, 0.25, and 0.27 BI units, respectively. For the SCA blocking case, the GEFS mean model blocking event was stronger by 0.46 BI units (Fig. 5
 ).
).
 |
Fig. (4) As in Fig. 1 for the GEFS 48 h forecast except the time is 12 h earlier than in Fig. 2. The block center is identified with a white ‘H’. BI for each GEFS model mean ensemble event is a) 1.98, b) 1.82, c) 4.19, and d) 4.75. |
 |
Fig. (5) The SCA blocking event observed BI (red - solid) and GEFS model BI (blue dotted) for the one-day lead-time GEFS ensemble mean forecast period. |
4.1.4. Discussion
Overall, the NCEP GEFS mean ensemble model forecasted the longitudinal location of the large-scale ridging and the onset of blocking [9Reynolds DD, Lupo AR, Jensen AD, Market PS. The predictability of Northern Hemisphere blocking using an ensemble mean forecast system. Electronic Conference on Atmospheric Science 2017 July 16-31; ]. With respect to onset timing, none of the blocking events studied here were forecast by the GEFS ensemble mean 10 days in advance, although the WWA blocking case does appear nine days in advance. At seven days lead-time, the timing of block onset was forecast by the ensemble model for the WWA blocking event. The two strong cold season blocking events were not even forecast yet. By four-days lead-time, the GEFS model ensemble forecast the onset of all four observed blocking events even if the onset time was late in the WWP and SCA blocking cases. Also, for the WWP and SCP, the blocking events were terminated by the GEFS model before the end of the 240 h forecast period even though these observed events would have persisted beyond the 10-day forecast range (not shown).
Even for the one-day GEFS ensemble mean model lead-time, the timing of block onset was missed by 24 h or less in one case (SCA). For three of the events, the GEFS model forecast the event to persist for the entire period, which was observed. The GEFS mean ensemble model did not show a block at the end of the 240 h period for the WWP blocking case since the observed blocking event persisted for only eight days. However, the termination of the WWP block in the GEFS ensemble model occurred 48- h before the observed decay (not shown). Thus, the GEFS ensemble model had more difficulty forecasting the persistence of Pacific Region blocking given the results of the four-day and one-day lead times.
Once the longer-lived (greater than 10 days) blocking events formed or occurred, the GEFS mean ensemble model blocking did persist throughout the same time period time as the observed blocking events [9Reynolds DD, Lupo AR, Jensen AD, Market PS. The predictability of Northern Hemisphere blocking using an ensemble mean forecast system. Electronic Conference on Atmospheric Science 2017 July 16-31; ]. At the onset time of the WWP block (8.5 days), the GEFS model ensemble forecast blocking event terminated 24-h after the observed event (not shown). The GEFS model ensemble forecasts issued after onset persisted the blocking event beyond the observed blocking termination to varying degrees. For the WWP and SCA blocking cases, it was not until the GEFS ensemble model forecasts issued after (or at) the observed block termination that no block appeared in the forecast. For the WWA case, the GEFS mean ensemble blocking persisted throughout the 10 days forecast, until after 1 July when the model terminated this event too early (not shown). Only in the SCP block did the GEFS mean ensemble model forecast the correct termination of the observed event as far as 10 days in advance (not shown). Thus, the difficulties in forecasting block termination, especially for events lasting more than 10 days, continue to show some difficulty as demonstrated by [57Matsueda M. Predictability of Euro-Russian blocking in summer of 2010. Geophys Res Lett 2011; 38: 6.] for the blocking events associated with the 2010 western Russia drought.
Comparing the GEFS ensemble model BI forecasts and observed BIs, demonstrates that the GEFS model blocking events were weaker generally across all events and lead times [9Reynolds DD, Lupo AR, Jensen AD, Market PS. The predictability of Northern Hemisphere blocking using an ensemble mean forecast system. Electronic Conference on Atmospheric Science 2017 July 16-31; ] (Figs 1, 4, and Table 4). The model forecast BI did improve as the initial forecast time approached the observed block onset time. It was not true, however, that GEFS model BI were uniformly weaker across every forecast time. Nonetheless, the best comparison of model to observed BIs occurred closest to observed block onset and closest to the model initialization time (Fig. 5) the SCA block. The GEFS mean model initialized at block onset and observed blocking BI were similar for the first five days of the event. For three of these days (including initialization) the mean model blocking BI was actually greater. However, beginning with 9 October 2016, the GEFS mean model BI decreased rapidly to 12 October and beyond. The observed SCA BI values were relatively constant throughout the period [9Reynolds DD, Lupo AR, Jensen AD, Market PS. The predictability of Northern Hemisphere blocking using an ensemble mean forecast system. Electronic Conference on Atmospheric Science 2017 July 16-31; ].
Since the GEFS ensemble mean forecast BI was uniformly less than observed BI values for all four events, there may be a systematic reason the models under-forecast the intensity as speculated in [9Reynolds DD, Lupo AR, Jensen AD, Market PS. The predictability of Northern Hemisphere blocking using an ensemble mean forecast system. Electronic Conference on Atmospheric Science 2017 July 16-31; ]. Firstly, it may be that this study examined the GEFS ensemble mean forecasts. Using the ensemble mean result in the smoothing of important features captured by individual ensemble members, and this issue would be expected to increase with lead-time due to ensemble spread. An examination of the individual 500 hPa height fields of ensemble members would reveal the extent of this issue through the calculation of BI. However, as shown for the SCA case, the model BIs are close to the observations early in the forecast or even larger (Figs. 1, 4, and 5).
There are other challenges for the GEFS model in capturing BI. The climatological NH BI standard deviation is 1.05 units [33Wiedenmann JM, Lupo AR, Mokhov II, Tikhonova EA. The climatology of blocking anticyclones for the northern and southern hemispheres: Block intensity as a diagnostic. J Clim 2002; 15: 3459-73.
[http://dx.doi.org/10.1175/1520-0442(2002)015<3459:TCOBAF>2.0.CO;2] ]. Thus, at forecast lead times close to block onset and/or shortly after model initialization, the GEFS ensemble model can reasonably approximate the BI for observed blocking events. In Table 4, the under-forecast in BI is about 8 - 15% for three of the four cases, but much greater for the WWA blocking event. However, the BI under-forecast issue continues to be significant even today in climate models [58Mokhov II, Timazhev AV, Lupo AR. Changes in atmospheric blocking characteristics within Euro-Atlantic region and Northern Hemisphere as a whole in the 21st century from model simulations using RCP anthropogenic scenarios. Global Planet Change 2014; 122: 265-70.
[http://dx.doi.org/10.1016/j.gloplacha.2014.09.004] , 59 Intergovernmental Panel on Climate Change (IPCC) 2013: Climate Change 2013: The Physical Scientific Basis; Contributions of Working Group I to the Fifth Assessment Report of the Intergovernmental Panel on Climate Change; IPCC: Geneva, Switzerland, Available online:
http://www.ipcc.ch]. Combining the under-forecast in model BI which is proportional to the height gradients [33Wiedenmann JM, Lupo AR, Mokhov II, Tikhonova EA. The climatology of blocking anticyclones for the northern and southern hemispheres: Block intensity as a diagnostic. J Clim 2002; 15: 3459-73.
[http://dx.doi.org/10.1175/1520-0442(2002)015<3459:TCOBAF>2.0.CO;2] ] with the observation that models continue to simulate weaker storm tracks [58Mokhov II, Timazhev AV, Lupo AR. Changes in atmospheric blocking characteristics within Euro-Atlantic region and Northern Hemisphere as a whole in the 21st century from model simulations using RCP anthropogenic scenarios. Global Planet Change 2014; 122: 265-70.
[http://dx.doi.org/10.1016/j.gloplacha.2014.09.004] ]. see chapter 9 suggests that model mid-latitude height gradients, in general, maybe too weak in spite of improvements in representing the height fields. By using the results of [33Wiedenmann JM, Lupo AR, Mokhov II, Tikhonova EA. The climatology of blocking anticyclones for the northern and southern hemispheres: Block intensity as a diagnostic. J Clim 2002; 15: 3459-73.
[http://dx.doi.org/10.1175/1520-0442(2002)015<3459:TCOBAF>2.0.CO;2] ], the degree to which the model 500 hPa height gradients are weaker can be estimated since they showed BI is proportional to the block region height gradients. They [33Wiedenmann JM, Lupo AR, Mokhov II, Tikhonova EA. The climatology of blocking anticyclones for the northern and southern hemispheres: Block intensity as a diagnostic. J Clim 2002; 15: 3459-73.
[http://dx.doi.org/10.1175/1520-0442(2002)015<3459:TCOBAF>2.0.CO;2] ] showed that a 50 m difference at 500 hPa between the numerator and denominator in the BI calculation could produce a BI that is about 1.0 units larger or smaller. Thus, this implies that the GEFS ensemble model blocking region 500 hPa height gradients are weaker than observed by about 50 m or less over a distance of approximately 2500 km [8Lupo AR, Smith PJ. Climatological features of blocking anticyclones in the Northern Hemisphere. Tellus 1995; 47A: 439-56.
[http://dx.doi.org/10.3402/tellusa.v47i4.11527] ] even at seven days lead time. Additionally, weaker storm tracks indicate that a model either produces weaker and/or fewer cyclones. If the model cyclones are weaker than observed, the discussion in section 3.5 suggests the model blocking events would be weaker as well.
Examining the model under-forecast for blocking BI in the context of thermodynamic forcing [9Reynolds DD, Lupo AR, Jensen AD, Market PS. The predictability of Northern Hemisphere blocking using an ensemble mean forecast system. Electronic Conference on Atmospheric Science 2017 July 16-31; , 60Tilly DE, Lupo AR, Melick CJ, Market PS. Calculated height tendencies in a Southern Hemisphere blocking and cyclone event: The contribution of diabatic heating to block intensification. Mon Weather Rev 2008; 136: 3568-78.
[http://dx.doi.org/10.1175/2008MWR2374.1] ] shows that surface sensible heating (a diabatic process) contributed 0.2 - 0.9 BI units to the total daily BI values for two Southern Hemisphere blocking events. As shown in Table 4, the day one lead-time forecast mean GEFS model blocking event BI were weaker by approximately the margin for the contribution of sensible heating [60Tilly DE, Lupo AR, Melick CJ, Market PS. Calculated height tendencies in a Southern Hemisphere blocking and cyclone event: The contribution of diabatic heating to block intensification. Mon Weather Rev 2008; 136: 3568-78.
[http://dx.doi.org/10.1175/2008MWR2374.1] ]. Thus, the representation of surface and/or diabatic processes, for example, in the GEFS ensemble model could account for under-forecast blocking BI.
CONCLUSION
Four blocking events that occurred between May 2016 and April 2017 were studied [9Reynolds DD, Lupo AR, Jensen AD, Market PS. The predictability of Northern Hemisphere blocking using an ensemble mean forecast system. Electronic Conference on Atmospheric Science 2017 July 16-31; ] and here, and these were chosen in order to examine Atlantic and Pacific Region events. These were also chosen to represent warm and cold season events as well as blocking events of different intensities. The SCP blocking event was studied [34Jensen AD, Lupo AR, Mokhov II, Akperov MG, Reynolds DD. Integrated regional enstrophy and block intensity as a measure of Kolmogorov Entropy. Atmosphere 2017; 8(12): 237.
[http://dx.doi.org/10.3390/atmos8120237] ] who found a relationship between BI, IRE, and Kolmogorov-Saini Entropy. Using the NCEP/NCAR reanalysis data set as well as the NCEP GEFS model initialization ensembles mean forecasts for a 240 h period, the ability of the model to forecast BI, longevity, onset, decay, and location. In this work, we used the 500-hPa heights and the blocking criterion in the study [33Wiedenmann JM, Lupo AR, Mokhov II, Tikhonova EA. The climatology of blocking anticyclones for the northern and southern hemispheres: Block intensity as a diagnostic. J Clim 2002; 15: 3459-73.
[http://dx.doi.org/10.1175/1520-0442(2002)015<3459:TCOBAF>2.0.CO;2] ] to identify blocking and calculate BI. Additionally, the IRE was calculated and compared to the BI as in the study [34Jensen AD, Lupo AR, Mokhov II, Akperov MG, Reynolds DD. Integrated regional enstrophy and block intensity as a measure of Kolmogorov Entropy. Atmosphere 2017; 8(12): 237.
[http://dx.doi.org/10.3390/atmos8120237] ]. The results found in the study [9Reynolds DD, Lupo AR, Jensen AD, Market PS. The predictability of Northern Hemisphere blocking using an ensemble mean forecast system. Electronic Conference on Atmospheric Science 2017 July 16-31; ] and here are given below. This study is unique from the previous studies in that a detailed analysis of the relationship between the precursor cyclones and their deepening rate is compared to the evolution of the block region IRE, as well as block onset and BI. Also, a more thorough discussion of the GEFS ensemble forecasts and blocking events is provided.
The location and block onset were reasonably well-forecast by the GEFS ensemble model. In all of the cases, the location of block onset, as well as the block location during the lifecycle, was the variable best forecast. The two weak warm-season blocking events were forecast to occur with eight and nine days of lead-time, while the two strong cold season events were forecast with about four days of lead-time. This shows improvement over the last few decades since [25Tibaldi SS, Tosi EE, Navarra AA, Pedulli LL. Northern and Southern Hemisphere Seasonal Variability of Blocking Frequency and Predictability. Mon Wea Rev 1994; 122: 1971-2003.
[http://dx.doi.org/10.1175/1520-0493(1994)122<1971:NASHSV>2.0.CO;2] ] and is consistent with current results [57Matsueda M. Predictability of Euro-Russian blocking in summer of 2010. Geophys Res Lett 2011; 38: 6.]. However, as shown by many studies, the GEFS ensemble model has difficulty with the persistence of longer-lived blocking events as well as block termination, again, a result consistent with studies such as [57Matsueda M. Predictability of Euro-Russian blocking in summer of 2010. Geophys Res Lett 2011; 38: 6.] and others.
The studies [33Wiedenmann JM, Lupo AR, Mokhov II, Tikhonova EA. The climatology of blocking anticyclones for the northern and southern hemispheres: Block intensity as a diagnostic. J Clim 2002; 15: 3459-73.
[http://dx.doi.org/10.1175/1520-0442(2002)015<3459:TCOBAF>2.0.CO;2] , 34Jensen AD, Lupo AR, Mokhov II, Akperov MG, Reynolds DD. Integrated regional enstrophy and block intensity as a measure of Kolmogorov Entropy. Atmosphere 2017; 8(12): 237.
[http://dx.doi.org/10.3390/atmos8120237] ] demonstrate that BI, a measure of block intensity, is related to dynamic quantities such as the local 500 hPa height gradients, enstrophy, and entropy. This variable was consistently under-forecast in the GEFS model mean ensemble forecasts here and in [9Reynolds DD, Lupo AR, Jensen AD, Market PS. The predictability of Northern Hemisphere blocking using an ensemble mean forecast system. Electronic Conference on Atmospheric Science 2017 July 16-31; ]. The ability of a model to forecast BI in an operational context has not been studied previously, however, the results of [9Reynolds DD, Lupo AR, Jensen AD, Market PS. The predictability of Northern Hemisphere blocking using an ensemble mean forecast system. Electronic Conference on Atmospheric Science 2017 July 16-31; ] found here are consistent with the under-forecast of BI in climate models. The analysis shown here suggests the under-forecast of BI could be due to the ability of the GEFS ensemble model to replicate the observed mass gradients, the parameterizations used in the model, or model dynamics. Additionally, the smoothing of individual ensemble members to create the ensemble mean may be leading to weaker model blocking here, and more study should be done to address this issue. Likely, it is the result of some combination of all these problems. However, the GEFS ensemble model could replicate BI early in the block lifecycle and shortly after initialization, but had difficulty in maintaining block BI.
Then, IRE was calculated in order to determine if the relationship between this quantity and BI first published in the study [34Jensen AD, Lupo AR, Mokhov II, Akperov MG, Reynolds DD. Integrated regional enstrophy and block intensity as a measure of Kolmogorov Entropy. Atmosphere 2017; 8(12): 237.
[http://dx.doi.org/10.3390/atmos8120237] ] could be identified in additional case studies. Both the study [9Reynolds DD, Lupo AR, Jensen AD, Market PS. The predictability of Northern Hemisphere blocking using an ensemble mean forecast system. Electronic Conference on Atmospheric Science 2017 July 16-31; ] and this study found that there could be a lagged relationship between IRE and BI by up to 72 h as indicated by statistically significant correlations between the two-time series. This suggests that the block formation and intensification paradigm proposed by [16Lupo AR, Smith PJ. Planetary and Synoptic-Scale Interactions During the Life Cycle of a Mid-Latitude Blocking Anticyclone Over the North Atlantic. Tellus. Special Issue: The Life Cycles of Extratropical Cyclones 1995; 47A: 575-96., 17Lupo AR, Bosart LF. An Analysis of a Relatively Rare Case of Continental Blocking. Q J R Meteorol Soc 1999; 125: 107-38.
[http://dx.doi.org/10.1002/qj.49712555308] , 51Lupo AR. A diagnosis of two blocking events that occurred simultaneously in the midlatitude Northern Hemisphere. Mon Wea Rev 1997; 1801-1823.
[http://dx.doi.org/10.1175/1520-0493(1997)125<1801:ADOTBE>2.0.CO;2] ] can be modified as first proposed by [9Reynolds DD, Lupo AR, Jensen AD, Market PS. The predictability of Northern Hemisphere blocking using an ensemble mean forecast system. Electronic Conference on Atmospheric Science 2017 July 16-31; ] and [34Jensen AD, Lupo AR, Mokhov II, Akperov MG, Reynolds DD. Integrated regional enstrophy and block intensity as a measure of Kolmogorov Entropy. Atmosphere 2017; 8(12): 237.
[http://dx.doi.org/10.3390/atmos8120237] ] with the study of additional cases. In short, block onset of intensification will occur in conjunction with a rapidly or explosively developing upstream cyclone located favorably upstream as in [17Lupo AR, Bosart LF. An Analysis of a Relatively Rare Case of Continental Blocking. Q J R Meteorol Soc 1999; 125: 107-38.
[http://dx.doi.org/10.1002/qj.49712555308] ]. Then, following the rapid cyclone development, the IRE increases concurrent with and following cyclogenesis, and finally block center point heights and BI increase. Additionally, the time between the start of rapid precursor cyclogenesis and the maximum lag correlation between IRE and BI varied inversely with the deepening rate for three of the four cases. In one case (and a blocking case from [34Jensen AD, Lupo AR, Mokhov II, Akperov MG, Reynolds DD. Integrated regional enstrophy and block intensity as a measure of Kolmogorov Entropy. Atmosphere 2017; 8(12): 237.
[http://dx.doi.org/10.3390/atmos8120237] ]), there was more than one rapidly developing upstream cyclone within five days of block onset making it difficult to determine if the deepening rate association discussed in the previous sentence was consistent for this case.
For the WWA and SCA blocking events, the AO and NAO correlated negatively to the IRE and BI during the block lifecycle, a new result found only here. The correlations were stronger for the SCA event. Similar correlations were found for the WWP and SCP blocking events between the AO, PNA, and BI, except the correlations, were not statistically significant. For the WWP blocking case, this could be due to the short duration. For the variable IRE in the WWP and SCP block cases, the correlations to the AO and PNA were positive, but not significant. In all four cases, the blocking events existed within particular teleconnective regimes and did not survive into the next NH or regional regime.
Some ideas for future research include examining the forecast of more blocking cases including the individual ensemble members in order to utilize the methodology to develop probabilistic forecasts [28Watson JS, Colucci SJ. Evaluation of ensemble predictions of blocking in the NCEP Global Spectral Model. Mon Weather Rev 2002; 130: 3008-21.
[http://dx.doi.org/10.1175/1520-0493(2002)130<3008:EOEPOB>2.0.CO;2] ]. More cases could also be examined in order to expand upon the relationship between the proposed IRE and BI lag relationship. Finally, the relationship between IRE, BI and the teleconnection indexes could be expanded in order to understand flow regime dynamics.
ETHICS APPROVAL AND CONSENT TO PARTICIPATE
Not applicable.
HUMAN AND ANIMAL RIGHTS
No animals/humans were used for studies that are basis of this research.
CONSENT FOR PUBLICATION
Not applicable.
AVAILABILITY OF DATA AND MATERIALS
The data that support findings of this study are available in United States National Oceanic and Atmospheric Administration (NOAA) Earth System Research Laboratory / Physical Sciences Division at https://www.esrl.noaa.gov/psd /data/ gridded/data.ncep.reanalysis.html and NOAA Climate Prediction Center Teleconnections at https://www.cpc.ncep. noaa.gov/products/precip/CWlink/daily_ao_index/teleconnections.shtml.
FUNDING
None.
CONFLICT OF INTEREST
The authors declare no conflict of interest, financial or otherwise.
ACKNOWLEDGEMENTS
The authors thank the two anonymous reviewers for their comments on this work. Their time and effort have improved the presentation of this work. AR Lupo and DD Reynolds conceived and designed the experiments; all four co-authors performed the experiments; all four co-authors analyzed the data; AR Lupo and DD Reynolds wrote the paper.
REFERENCES
| [1] | Shukla JJ, Mo KC. Seasonal and geographical variation of blocking. Mon Weather Rev 1983; 111: 388-402. [http://dx.doi.org/10.1175/1520-0493(1983)111<0388:SAGVOB>2.0.CO;2] |
| [2] | Lejenas H, Okland H. Characteristics of northern hemisphere blocking as determined from a long time series of observational data. Tellus 1983; 35A: 350-62. [http://dx.doi.org/10.1111/j.1600-0870.1983.tb00210.x] |
| [3] | Pelly JL, Hoskins BJ. How well does the ECMWF ensemble prediction system predict blocking. Q J R Meteorol Soc 2003; 129: 1683-703. [http://dx.doi.org/10.1256/qj.01.173] |
| [4] | Schwierz C, Croci-Maspoli M, Davies HC. Perspicacious indicators of atmospheric blocking. Geophys Res Lett 2004; 31(6) [http://dx.doi.org/10.1029/2003GL019341] |
| [5] | Barriopedro D, Garcia-Herrera R, Lupo AR, Hernandez E. A climatology of Northern Hemisphere blocking. J Clim 2006; 19: 1042-63. [http://dx.doi.org/10.1175/JCLI3678.1] |
| [6] | Lupo AR, Jensen AD, Mokhov II, Timazhev AV, Eichler T. Changes in global blocking character during the most recent decades Atmosphere 2019; 10(19) |
| [7] | Pinhero MC, Ullrich PA, Grotjahn R. Atmospheric blocking and intercomparison of objective detection methods: flow field characteristics. Clim Dyn 2019; 35: 1-28. [http://dx.doi.org/10.1007/s00382-019-04782-5] |
| [8] | Lupo AR, Smith PJ. Climatological features of blocking anticyclones in the Northern Hemisphere. Tellus 1995; 47A: 439-56. [http://dx.doi.org/10.3402/tellusa.v47i4.11527] |
| [9] | Reynolds DD, Lupo AR, Jensen AD, Market PS. The predictability of Northern Hemisphere blocking using an ensemble mean forecast system. Electronic Conference on Atmospheric Science 2017 July 16-31; |
| [10] | Matsueda M, Kyouda M, Toth Z, Tanaka HL, Tsuyuki T. Predictability of an atmospheric blocking event that occurred on 15 December 2005. Mon Weather Rev 2011; 139: 2455-70. [http://dx.doi.org/10.1175/2010MWR3551.1] |
| [11] | Hussain A, Lupo AR. Scale and stability analysis of blocking events from 2002-2004: A case study of an unusually persistent blocking event leading to a heat wave in the Gulf of Alaska during August 2004. Adv Meteor 2010; 15. [http://dx.doi.org/10.1155/2010/610263] |
| [12] | Nunes MJ, Lupo AR, Lebedeva MG, Chendev YG, Solovyov AB. The occurrence of extreme monthly temperatures and precipitation in two global regions 2017. [http://dx.doi.org/10.1080/23754931.2017.1286253] |
| [13] | Sillmann J, Mischa MC, Kallache M, Katz RW. Extreme cold winter temperatures in Europe under the influence of North Atlantic atmospheric blocking. J Clim 2011; 24(22): 5899-913. [http://dx.doi.org/10.1175/2011JCLI4075.1] |
| [14] | Bissolli P, Friedrich K, Rapp J, Ziese M. Flooding in eastern central Europe in May 2010—reasons, evolution and climatological assessment. Weather 2011; 66(6): 147-53. [http://dx.doi.org/10.1002/wea.759] |
| [15] | Webster P, Toma VE, Kim H-M. Were the 2010 Pakistan floods predictable? Geophys Res Lett 2011; 38: 5. |
| [16] | Lupo AR, Smith PJ. Planetary and Synoptic-Scale Interactions During the Life Cycle of a Mid-Latitude Blocking Anticyclone Over the North Atlantic. Tellus. Special Issue: The Life Cycles of Extratropical Cyclones 1995; 47A: 575-96. |
| [17] | Lupo AR, Bosart LF. An Analysis of a Relatively Rare Case of Continental Blocking. Q J R Meteorol Soc 1999; 125: 107-38. [http://dx.doi.org/10.1002/qj.49712555308] |
| [18] | Lupo AR, Mokhov II, Akperov MG, Cherokulsky AV, Athar H. A dynamic analysis of the role of the planetary and synoptic scale in the summer of 2010 blocking episodes over the European part of Russia. Adv Meteorol 2012; 11. [http://dx.doi.org/10.1155/2012/584257] |
| [19] | Woollings T, Barriopedro D, Methven J, et al. Blocking and its response to climate change. Curr Clim Change Rep 2018; 4(3): 287-300. [http://dx.doi.org/10.1007/s40641-018-0108-z] [PMID: 30956938] |
| [20] | Lorenz EN. Deterministic Nonperiodic Flow. J Atmos Sci 1963; 130-141. [http://dx.doi.org/10.1175/1520-5030469] |
| [21] | Lorenz EN. A study of the predictability of a 28-variable model. J Atmos Sci 1965; 20: 130-41. [http://dx.doi.org/10.1175/1520-0469(1963)020<0130:DNF>2.0.CO;2] |
| [22] | Jensen AD, Lupo AR, Mokhov II, Akperov MG, Sun F. The dynamic character of Northern Hemisphere flow regimes in a near term climate change projection. Atmosphere 2018; 9(1): 27. [http://dx.doi.org/10.3390/atmos9010027] |
| [23] | Lupo AR, Li YC, Feng ZC, Fox NI, Rabinowitz JL, Simpson MA. Sensitive Versus Rough Dependence in Initial Conditions in Atmospheric Flow Regimes. Atmosphere 2016; 7: 157. [http://dx.doi.org/10.3390/atmos7120157] |
| [24] | Li, YC Linear Hydrodynamic Stability. Not Am Math Soc 2018; 65(10): 1255-9. |
| [25] | Tibaldi SS, Tosi EE, Navarra AA, Pedulli LL. Northern and Southern Hemisphere Seasonal Variability of Blocking Frequency and Predictability. Mon Wea Rev 1994; 122: 1971-2003. [http://dx.doi.org/10.1175/1520-0493(1994)122<1971:NASHSV>2.0.CO;2] |
| [26] | Colucci SJ, Baumhefner DP. Numerical prediction of the onset of blocking: A case study with forecast ensembles. Mon Weather Rev 1998; 126: 773-84. [http://dx.doi.org/10.1175/1520-0493(1998)126<0773:NPOTOO>2.0.CO;2] |
| [27] | Colucci SJ, Alberta TL. Planetary-scale climatology of explosive cyclogenesis and blocking. Mon Weather Rev 1996; 124: 2509-20. [http://dx.doi.org/10.1175/1520-0493(1996)124<2509:PSCOEC>2.0.CO;2] |
| [28] | Watson JS, Colucci SJ. Evaluation of ensemble predictions of blocking in the NCEP Global Spectral Model. Mon Weather Rev 2002; 130: 3008-21. [http://dx.doi.org/10.1175/1520-0493(2002)130<3008:EOEPOB>2.0.CO;2] |
| [29] | Brankovic C, Palmer TN, Molteni F, Tibaldi S, Cubasch U. Extended-range predictions with ECMWF models: Time-lagged ensemble forecasting. Q J R Meteorol Soc 1990; 116: 857-912. [http://dx.doi.org/10.1002/qj.49711649405] |
| [30] | Wilks DS. Statistical Methods in the Atmospheric Sciences: An Introduction 1995; 467: 520. |
| [31] | Jensen AD, Lupo AR. Using enstrophy advection as a diagnostic to identify blocking regime transition. Q J R Meteorol Soc 2013; 139: 2-7. [http://dx.doi.org/10.1002/qj.2248] |
| [32] | Dymnikov VP, Kazantsev YV, Kharin VV. Information entropy and local Lyapunov exponents of barotropic atmospheric circulation. Izv, Atmos Ocean Phys 1992; 28: 425-32. |
| [33] | Wiedenmann JM, Lupo AR, Mokhov II, Tikhonova EA. The climatology of blocking anticyclones for the northern and southern hemispheres: Block intensity as a diagnostic. J Clim 2002; 15: 3459-73. [http://dx.doi.org/10.1175/1520-0442(2002)015<3459:TCOBAF>2.0.CO;2] |
| [34] | Jensen AD, Lupo AR, Mokhov II, Akperov MG, Reynolds DD. Integrated regional enstrophy and block intensity as a measure of Kolmogorov Entropy. Atmosphere 2017; 8(12): 237. [http://dx.doi.org/10.3390/atmos8120237] |
| [35] | Toth Z, Kalnay E. Ensemble forecasting at NMC: The generation of perturbations. Bull Am Meteorol Soc 1993; 74: 2317-30. [http://dx.doi.org/10.1175/1520-0477(1993)074<2317:EFANTG>2.0.CO;2] |
| [36] | Tracton M, Kalnay E. Operational ensemble prediction at the national meteorological center: Practical aspects. Weather Forecast 1993; 8: 379-98. [http://dx.doi.org/10.1175/1520-0434(1993)008<0379:OEPATN>2.0.CO;2] |
| [37] | Kalnay EE, Kanamitsu MM, Kistler R, et al. The NCEP/NCAR 40-Year Reanalysis Project. Bull Am Meteorol Soc 1996; 77: 437-71. [http://dx.doi.org/10.1175/1520-0477(1996)077<0437:TNYRP>2.0.CO;2] |
| [38] | Rex DF. Blocking action in the middle troposphere and its effect on regional climate II: The climatology of blocking action. Tellus 1950; 3: 275-301. |
| [39] | Triedl RA, Birch EC, Sajecki P. Blocking action in the Northern Hemisphere: A climatological study. Atmos-ocean 1981; 19: 1-23. [http://dx.doi.org/10.1080/07055900.1981.9649096] |
| [40] | Shapiro R. Smoothing, filtering, and boundary effects. Rev Geophys 1970; 8: 359-87. [http://dx.doi.org/10.1029/RG008i002p00359] |
| [41] | Jensen AD, Lupo AR. Using Enstrophy Based Diagnostics in an Ensemble for Two Blocking Events 2013; 7 [http://dx.doi.org/10.1155/2013/693859] |
| [42] | Jensen AD, Lupo AR. The Role of Deformation and Other Quantities in an Equation for Enstrophy as Applied to Atmospheric Blocking. Dyn Atmos Oc 2014. [http://dx.doi.org/10.1016/j.dynatmoce.2014.03.004] |
| [43] | Jensen AD, Lupo AR, Mokhov II, Akperov MG, Sun F. The dynamic character of Northern Hemisphere flow regimes in a near term climate change projection. Atmosphere 2018; 9(1): 27. [http://dx.doi.org/10.3390/atmos9010027] |
| [44] | Lupo AR, Mokhov II, Dostoglou S, Kunz AR, Burkhardt JP. The impact of the planetary scale on the decay of blocking and the use of phase diagrams and enstrophy as a diagnostic. Izv. Atms-Oc 2007; 43: 45-51. [http://dx.doi.org/10.1134/S0001433807010057] |
| [45] | Wallace JM, Gutzler DS. Teleconnections in the geopotential height field during the Northern Hemisphere winter. Mon Weather Rev 1981; 109: 784-812. [http://dx.doi.org/10.1175/1520-0493(1981)109<0784:TITGHF>2.0.CO;2] |
| [46] | Renken JD, Herman JJ, Bradshaw TR, Market PS, Lupo AR. The Utility of the Bering Sea and Typhoon Rules in Long Range Forecasting. Advances in Meteorology 2017. [http://dx.doi.org/10.1155/2017/1765428] |
| [47] | Feldstein SB. The dynamics of NAO teleconnection pattern growth and decay. Q J R Meteorol Soc 2003; 129: 901-24. [http://dx.doi.org/10.1256/qj.02.76] |
| [48] | Luo D, Lupo AR, Wan H. Dynamics of eddy-driven low-frequency dipole modes. Part I: A simple model of North Atlantic Oscillations. J Atmos Sci 2007; 64: 3-28. [http://dx.doi.org/10.1175/JAS3818.1] |
| [49] | Luo D, Gong T, Lupo AR. Dynamics of eddy-driven low-frequency dipole modes. Part II: Free mode characteristics of NAO and diagnostic study. J Atmos Sci 2019; 64: 29-51. |
| [50] | Lebedeva, MG, Lupo, AR, Chendev, YG, Krymskaya, OV, Solovyev AB. Changes in the atmospheric circulation conditions and regional climatic characteristics in two remote regions since the mid-20th century. Atmosphere 2019; 10: 23. |
| [51] | Lupo AR. A diagnosis of two blocking events that occurred simultaneously in the midlatitude Northern Hemisphere. Mon Wea Rev 1997; 1801-1823. [http://dx.doi.org/10.1175/1520-0493(1997)125<1801:ADOTBE>2.0.CO;2] |
| [52] | Sanders F, Gyakum JR. Synoptic-dynamic climatology of the “bomb”. Mon Weather Rev 1980; 108: 1577-89. [http://dx.doi.org/10.1175/1520-0493(1980)108<1589:SDCOT>2.0.CO;2] |
| [53] | Haines K. Holland, AJ vacillation cycles and blocking in a channel. Q J R Meteorol Soc 1998; 124: 873-97. [http://dx.doi.org/10.1002/qj.49712454711] |
| [54] | Michel C, Rivière G. The link between Rossby wave breakings and weather regime transitions. J Atmos Sci 2011; 68: 1730-48. [http://dx.doi.org/10.1175/2011JAS3635.1] |
| [55] | Luo D, Lupo AR, Wan H. Dynamics of eddy-driven low-frequency dipole modes. Part I: A simple model of North Atlantic Oscillations. J Atmos Sci 2007; 64: 29-51. [http://dx.doi.org/10.1175/JAS3820.1] |
| [56] | Huang W, Chen R, Wang B, Wright JS, Yang Z, Ma W. Potential vorticity regimes over East Asia during winter. J Geophys Res Atmos 2016; 122. |
| [57] | Matsueda M. Predictability of Euro-Russian blocking in summer of 2010. Geophys Res Lett 2011; 38: 6. |
| [58] | Mokhov II, Timazhev AV, Lupo AR. Changes in atmospheric blocking characteristics within Euro-Atlantic region and Northern Hemisphere as a whole in the 21st century from model simulations using RCP anthropogenic scenarios. Global Planet Change 2014; 122: 265-70. [http://dx.doi.org/10.1016/j.gloplacha.2014.09.004] |
| [59] | Intergovernmental Panel on Climate Change (IPCC) 2013: Climate Change 2013: The Physical Scientific Basis; Contributions of Working Group I to the Fifth Assessment Report of the Intergovernmental Panel on Climate Change; IPCC: Geneva, Switzerland, Available online: http://www.ipcc.ch |
| [60] | Tilly DE, Lupo AR, Melick CJ, Market PS. Calculated height tendencies in a Southern Hemisphere blocking and cyclone event: The contribution of diabatic heating to block intensification. Mon Weather Rev 2008; 136: 3568-78. [http://dx.doi.org/10.1175/2008MWR2374.1] |