- Home
- About Journals
-
Information for Authors/ReviewersEditorial Policies
Publication Fee
Publication Cycle - Process Flowchart
Online Manuscript Submission and Tracking System
Publishing Ethics and Rectitude
Authorship
Author Benefits
Reviewer Guidelines
Guest Editor Guidelines
Peer Review Workflow
Quick Track Option
Copyediting Services
Bentham Open Membership
Bentham Open Advisory Board
Archiving Policies
Fabricating and Stating False Information
Post Publication Discussions and Corrections
Editorial Management
Advertise With Us
Funding Agencies
Rate List
Kudos
General FAQs
Special Fee Waivers and Discounts
- Contact
- Help
- About Us
- Search


The Open Cell Signaling Journal
(Discontinued)
ISSN: 1876-3901 ― Volume 4, 2012
Importance of CDK7 for G1 Re-Entry into the Mammalian Cell Cycle and Identification of New Downstream Networks Using a Computational Method
Hideko Sone*, 1, 2, §, Tomokazu Fukuda3, §, Hiroyoshi Toyoshiba11, §, Takeharu Yamanaka1, Fred Parham1 , Christopher J Portier1
Abstract
Many of the key molecules in cell cycle progression (e.g. pRB, cyclin complexes) and their basic interactions are oncogene or tumor suppressor genes, which are well characterized in the clinical and experimental analysis. However, there are still unknown mechanisms for the cell cycle regulation, which is critical step for the progression of the cancer development. Especially it is not fully understood how the cells move to G1 phase from quiescent G0 phase in the mammalian cells. To find out the new gene networks associated with the two transition of the mammalian cell cycle (G0 to G1 and G1 to S phase), we analyzed the linkages between 39 representative oncogene or tumor suppressor genes, which related to the cell cycle regulation, with gene expression sets obtained from the publicly opened microarray data for mouse embryonic fibroblasts that synchronized by the serum starvation or hydroxyurea treatment. Analyses with a qualitative algorithm based on Bayesian networks that assume a log-linear relationship between genes have applied, and newly found networks were validated. Results highlighted the importance of two master genes, Cdk7 and Cdkna2 for the re-entry to G1 from G0, and suggested a new network connection from Cdk7 to downstream molecules, including the EGF receptor and N-myc. Introduction of a recombinant Cdk7 with retrovirus decreased endogenous EGFR and N-myc protein levels. The results supported the computational prediction of the Cdk7 network. Taken together, these result showed the existence of new regulating pathway from Cdk7 to Egfr and N-myc, suggesting this analytical approach provides an assessment of regulatory networks in complex mammalian cells, and the process of the carcinogenesis.
Article Information
Identifiers and Pagination:
Year: 2010Volume: 2
First Page: 1
Last Page: 12
Publisher Id: TOCELLSJ-2-1
DOI: 10.2174/1876390101002010001
Article History:
Received Date: 5/11/2009Revision Received Date: 1/2/2010
Acceptance Date: 1/3/2010
Electronic publication date: 2/4/2010
Collection year: 2010
open-access license: This is an open access article licensed under the terms of the Creative Commons Attribution Non-Commercial License (http://creativecommons.org/licenses/by-nc/3.0/) which permits unrestricted, non-commercial use, distribution and reproduction in any medium, provided the work is properly cited.
* Address correspondence to this author at the Research Center for Environmental Risk, National Institute for Environmental Studies, 16-2 Onogawa, Tsukuba 305-8506, Japan; Tel: +81.298.50.2464; Fax: +81.298.50.2546; E-mail: hsone@nies.go.jp§ These authors equally contributed to this work.
| Open Peer Review Details | |||
|---|---|---|---|
| Manuscript submitted on 5-11-2009 |
Original Manuscript | Importance of CDK7 for G1 Re-Entry into the Mammalian Cell Cycle and Identification of New Downstream Networks Using a Computational Method | |
INTRODUCTION
Cell division and tissue growth represent two of the most fundamental biological processes and play essential roles in development, aging, cancer [1, 2], and many other diverse events. Although gene transcripts have been comprehensively catalogued in yeast, much work remains to be done in higher organisms. Especially, for tumor progression, the gene networks underlying the regulation of the cell cycle are not well understood in cancer cells or the initiated precancerous cells. Several groups have utilized microarrays to perform serial analyses of gene expression during cellular replication in normal or cancer human and mouse cell lines [3-6]. These microarray data have been analyzed using clustering approaches such as hierarchical clustering and k-means to identify stage-specific or co-regulated genes through each phase of the cell cycle. However, these methodologies can only identify genes with expression levels that correlate over time, and the network dynamics of the cell cycle is not yet fully understood.
Integrated and networked functions in mammalian cells can be identified and quantified through the use of a computational model. Efforts to systematically define specific gene network structures to further understand the functions and dynamics of each gene and its protein products have lead to a new generation of in silico analysis tools that use diagrams to depict the logical relationships between genes [7-9]. To infer unknown gene networks from microarray gene expression data, the methods adopted need to incorporate the two different aspects of Bayesian models and associated validation tools. The application of these biostatistical methods has the potential to elucidate unknown mechanisms underlying the key regulatory systems of mammalian cells [10-12].
The regulatory mechanisms for the G0 quiescent stage of the cell cycle remain largely unknown. For the efficient progression from the G0 to G1 phase, the protein level of the p27/kip1 is known to have a important role in T cell from in vitro study and a knockout mouse study [13, 14]. In the normal cells, the protein level of p27 is high during G0 phase but decreases rapidly on the entry to G1 [14, 15]. The degradation of p27 is controlled by an SCF complex, which involves SKP2 [16, 17]. Although these findings for G0-G1 regulation have had a significant impact, it is not clear whether these mechanisms can be applied to the all type of cells and tissues. For cancer therapeutics, the G0-G1 transition of the cell cycle has been a strong target to prevent tumor growth and progression [18-20].
In our current study, we employed the gene datasets from the publicly opened microarray data for the mouse fibroblasts, which synchronized with the serum starvation and hydroxyarea, which are the study of the transition from a quiescent state into the cell cycle in mouse embryonic fibroblast (MEF) cells reported by Ishida et al. [4]. In order to elucidate new gene networks related to the progression of the cell cycle, the gene expression datasets were analyzed using a series of approaches in which putative network structures are elucidated using Bayesian networks. These approaches involve a likelihood-based selection algorithm to qualitatively infer the identity of the network structure [21] and a quantitative algorithm involving a Markov chain Monte Carlo (MCMC) method [22, 23] is then used to quantify the structure. The identified interactions between genes that are based upon these predicted gene networks were then validated using a retrovirus expression system.
MATERIALS AND METHODS
Microarray Data Sets
Previously published mouse embryonic fibroblast (MEF) cell microarray datasets were used in our analyses [4]. Briefly, the cells were synchronized by either serum starvation or hydroxyurea treatment. We used the data sets obtained from the serum starved cells for the analysis of re-entry into G1 from G0 (0, 6, 12, 15, 18, 21, 24 hours after serum starvation), and those from the hydroxyurea exposed fibroblasts for the G1-S analysis (0, 3, 6, 9, 12, 15, 18 hours after the treatment). The detailed methods used to obtain these microarray data have been previously described [4].
Selection of the Subset Database
The original gene expression data, comprising about 6437 genes, were screened for genes that showed at least a 2.0-fold change (up- or down-regulation) using GenMAPP [24]. The distribution and frequency of the fold changes (relative to the time 0) at each time point were analyzed by MAPFinder 1.0 beta, an accessory tool of GenMAPP, to identify the optimal biological maps. From this collection of maps, we selected those related to cell cycle processes that had a “z” score greater than 1.95 (the z score represents the difference between the observed number of genes meeting the criteria and the expected number of genes meeting the criteria in each map based on gene ontology). As detailed in Table 1, 10 maps were selected based on gene ontology (denoted MAPP) and the relationship to the cell cycle. A subset of 39 genes was chosen from among the MAPP maps selected (Table 2). The abbreviated names of the genes that were analyzed in this report are presented according to the displays listed in GenMAPP.


Mathematical Models
We applied the expression-associated network modeling method previously developed by Yamanaka et al. [21] to the fold-change data from the gene-expression data sets. This method falls under the general area of Bayesian networks, with a likelihood-based selection algorithm used to identify the most promising networks. In general, if X1, X2….Xp represents the data obtained for p genes, N denotes a network, and θ denotes parameters in that network, with the likelihood given by:
- The choice of the best network would be the one with the largest value of the posterior density at the chosen network topology; that is
find where - The Bayesian network used in this analysis had the following assumptions:
with these assumptions,
Thus, it is possible to focus on each gene rather than the whole network and still obtain a global optimum. To quantify rates in the gene-expression network, we used the Bayesian methods developed by Toyoshiba et al. [22, 23]. Supposing that Xi (i=1,2,3…p) represents the natural log of the relative ratio, the functional relationships between the genes could be characterized using the log-linear model below:
where Iji is an indicator function (-1, 0, 1) characterizing the effect from Gj to Gi, T represents a matrix having Iij as the (i,j) element, and βj.=[βj1, βj2βj3βj4... βjp] is the vector in which each βji is the magnitude by which one unit of gene Xj will affect the expression levels of gene Xi. Thus, if Iji is not equal to 0, Pa(Xi) contains Xj.If f (Xi| T, θ ) is defined as the distribution of gene expression in the given model, then the likelihood is written as
where θ represents the parameter vector in the model.
By Bayes’ theorem, the prior distribution is given by
The posterior distributions fθ|X,T were evaluated using the MCMC method. In our analyses, fX|T,θ was assumed to be normal, with a mean defined by equation (8) and a random variance whose prior distribution was assumed to be uniform with 0 as the lower bound and twice the maximum STD for each gene distribution. The prior distribution for θ and fθ was assumed to be lognormal with a mean of 0 and a variance of 1.0.
The MCMC analysis was applied as described in [23] and [22]. A typical MCMC run was 100,000 samples with the first 20% of the samples discarded to “burn in” the algorithm. Some runs were much longer depending on convergence and stabilization of the resulting posterior distributions.
The model described in this section is an analysis tool and is not intended to characterize the mechanisms by which the different genes are linked. Instead, it is intended to find the most prominent linkages between cells to provide hypotheses that can be further explored and later modeled mechanistically.
Visualization of Gene Networks and Clustering Analysis
We used a MATLAB script newly developed by Parham et al. (unpublished data) to generate transcriptional regulatory networks using MATLAB version 6.5 (The MathWorks, Inc., Natick, MA).
Establishment of Mouse CDK7 Recombinant Retrovirus
A full length cDNA fragment of mouse cyclin-dependent kinase (Cdk)7 (NIH Mammalian Gene bank accession number: NM_009874) was obtained by RT-PCR from the total RNA extracts of 13.5 day mouse embryo using a previously described method [25]. A hemagglutinin (HA) protein tag sequence was then introduced at the carboxyl terminus of this mouse Cdk7 cDNA using a tailed PCR method. The Cdk7 cDNA was next subcloned into the EcoRV site of pBluescript SKII+ (Stratagene, La Jolla, CA) by blunt end ligation, and the resulting constructs were validated using a cycle sequencing reaction in an ABI 310 genetic analyzer (Applied Biosystems, Foster City, CA). The subcloned Cdk7 cDNA fragment was then transferred into the multiple cloning site of an LXIN retrovirus vector (Clontech, Mountain View, CA). Both empty LXIN vector and LXIN vector harboring the mouse Cdk7 cDNA were introduced into PT67 retrovirus packaging cells (Clontech) using Fugene6 (Roche, Basel, Switzerland). Infected cells were then selected with 1mg/ml G418 (Invitrogen, Carlsbad, CA ) in the growth media for one week.
Measurement of the Retrovirus Titers in the Producer Cells
Conditioned medium from the producer cells was diluted 1:10 and 1:50 with DMEM containing 10% calf serum, and then used for the infection of NIH3T3 cells to measure the titer of the synthesized retrovirus. NIH3T3 cells were grown in media with diluted retroviruses for two days under the same conditions that are described below for mouse embryonic fibroblasts. The infected NIH3T3 cells were diluted 1:100 and 1:1000, and then selected with 1mg/ml G418 for one week. Retrovirus titers of the original conditioned medium were calculated based on the number of colonies demonstrating G418 resistance.
Preparation of MEF Cells that Expresses the Recombinant Mouse CDK7
Mouse embryonic fibroblasts (MEF) were prepared using a previously described method [25]. Second passage primary fibroblasts at a 70% confluency were infected with conditioned medium containing PT67 producer cells at a 1:2 dilution 1:2 with basal MEF medium for 2 days in the presence of 1µg/ml polybrene (Sigma-Aldrich, St. Louis, MO). When the infected MEF cells reached confluence, they were diluted 1:5 as above and selected with 200µg/ml G418 for one week. Control experiments confirmed that non-infected MEF cells did not survive in the presence of 200µg/ml G418 (data not shown). Infected cells selected with G418 were subjected to lysis and protein extraction for western blot analyses.
Western Blot Analyses of MEF Cells Exogenously Expressing Mouse CDK7
Total proteins were isolated from MEF cells infected with either control or Cdk7 recombinant retrovirus using a standard methodology [25]. Heat-denatured proteins were separated by 10% SDS-PAGE and the proteins in the gel were transferred to polyvinylidene difluoride (PVDF) membranes (Immobilon P, Millipore, Billerica, MA). After blocking with 1% non-fat dry milk-Tris buffered saline and 0.1% Tween 20 (TBST), the membranes were probed with anti-HA (High affinity HA 3F10, 1:5,000 dilution, Roche), anti-α-CDK7 (sc-723, 1:5,000 dilution, Santa Cruz, CA), anti-EGFR (kindly provided by Dr. DiAugustine, RP) and anti-N-MYC1 (sc-791, 1:1,000 dilution, Santa Cruz, CA) and anti-c-FOS (sc-52, 1:1,000 dilution, Santa Cruz, CA) antibodies. Blots were then incubated with horseradish peroxidase (HRP)-conjugated rabbit anti-rat IgG (A5795, 1:5,000 dilution, Roche) or donkey anti-rabbit IgG (1:5,000 dilution, GE Healthcare Bioscience) secondary antibodies, respectively. Immunoreactive proteins were detected by enhanced chemiluminescence (P90720, Millipore). Signal intensities from the western blots were detected with X-ray film and quantified using NIH3T3 image software.
RESULTS
Strategy and Analysis of Gene Network Structures
Our experimental strategy is illustrated in Fig. (1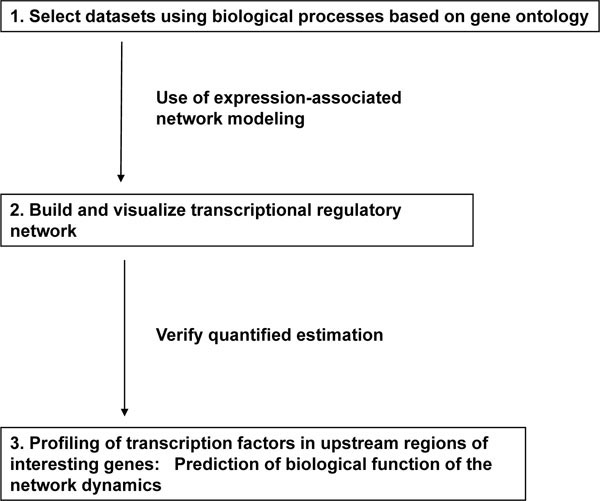 ) and consists of three steps: selection of datasets, visualization and analysis by mathematical modeling, and prediction of biological function through the analysis of transcripts. Genome-wide expression data can provide information linking diverse genes and may be useful as a classification tool to identify alterations in biological processes linked to disease. In contrast, carefully designed analyses of a limited gene group associated with a specific biological process can be used to quantify the dynamics of a gene regulatory network. The genes associated with cell cycle regulation are an obvious target for this type of analysis and are the focus of our current study.
 |
Fig. (1) Strategy used to identify, analyze, and validate regulatory gene networks. |
The first step in our approach was to select a data subset from a pool of genes associated with various aspects of cell cycle-related processes. The gene choices were based on the gene ontology of the mouse genome using GenMAPP, a computer application designed for the visualization of gene expression data by using maps representing biological pathways. This technique provided a qualitative tool for grouping genes (see Materials and methods). To gather gene expression data associated with the cell cycle, mouse embryo fibroblasts (MEFs) [4] were serum starved or exposed to hydroxyurea to synchronize and control their movement through the cell cycle. At various time points following the release from G0 and cell cycle re-entry, the mRNA expression levels for 6437 genes was measured using a microarray. For 10 cell-cycle related maps (Table 1), 145 genes were measured in the microarray assay. Of these 145 genes, 50 genes met the criteria of at least 2-fold higher or lower levels as shown in Table 1. Since the number of genes analyzed using TAO-gen had to be reduced due to computer processing limitations, 39 out of these 50 genes were finally selected for further analysis based on tissue-specific expression information and their biological significance from published articles after removing overlapping genes.
Two separate maps linking our selected 39 genes to a network were generated using the G0 course data subset (serum starvation) and the G1/S course data subset (hydroxyurea treatment). Although the expression of these genes is dynamic during the cell cycle, the networks were modeled by assuming equilibrium between the genes and by evaluating those using formal statistical methods that quantified any linkages and assessed their significance. Nodal genes (genes that appeared to be linked to a large number of other genes) were positively identified in the network. In the final verification step, the promoter regions of the genes targeted by each nodal gene were analyzed for common transcriptional factor binding sites. Finally, we discuss the roles of the central nodes and the dynamics of the quantified network in relation to the murine cell cycle.
Identification of a Gene Network Based on Expression Profiles
Representative maps using our 39 gene networks were developed separately for the G0 course (Fig. 2A ) and the G1/S course (Fig. 3A
 ). The number of linkages in these two networks is summarized in Table 3. Name abbreviations of the genes analyzed in this paper are shown according to their listing in GenMAPP. These networks were developed using Bayesian networks and a mathematical model allowing each of these mRNAs to connect to any other through direct or indirect transcriptional regulation leading to gene expression changes.


The network from the G0 course data subset in which the cells had been serum starved indicates that the cyclin-dependent kinase inhibitor 2A (Cdkn2a) and Cdk7 are central nodes (Fig. 2B, C), whereas E2f1, known to regulate the G0-G1 transition, plays a lesser role. Although the Cdkn2a and Cdk7 gene products and related molecules have been suggested to functions in regulating G1 entry and progression from side supportive data [26, 27], it was not clear until our current findings whether these molecules functioned as central nodes in the gene networks. Cdkn2a and Cdk7 were not classified as a G0 cluster via k-means in the first report of these microarray data [4]. CDKs are known to be key components of the core cell cycle machinery and are inhibited by cyclin-dependent protein kinase inhibitors (CDKNs). CDK7 and CDKN2A are members of the CDK and CDKN families, respectively. Cdkn2a also encodes p16INK4a, a protein that indirectly regulates the activities of both pRB and p53 through the inhibition of CDK4 and CDK6. The predictive pathway from Cdk7 suggests that CDK7 down-regulates Ccna2, Egfr, Il1a, Mybl2, Nmyc1 and Nras, and up-regulates Etv6, Figf, Pgf and Rbl1 (Fig. 2C). For the time course of the expression levels of Cdk7, Ccna2, Egfr, Mybl2, N-myc and Nras following the release from serum starvation, when the cells enter G1, the expression levels of Cdk7 are reduced, resulting in the elevated expression of Ccna2, Egfr, Mybl2, N-myc and Nras (data not shown).
In the network found for the G1/S start data subset in hydroxyurea treated MEFs, the structure was observed to be more complicated and have no obvious central nodes. In this network, the number of connections from Cdk7 and Cdkn2a to other genes was greatly decreased, whereas the connections from Ccna2, Egfr, Fgf3, Trp53, Nmyc1, Ptn, and Rbl2 were increased (Fig. 3A). These changes suggested that growth factors, such as Egfr, Fgf3, and Ptn, and proliferation regulators, such as Ccna2, Trp53, and Rbl2, have more prominent roles during S phase progression (Fig. 3B-E). From these data, it becomes obvious that the gene networks which regulate the progression of the cell cycle completely differ between the G0-G1 and G1-S transitions.
Verification of the Quantified Network
Further analyses were conducted to determine the statistical significance of the linkages between our identified genes. To find the most prominent linkages between genes of
the network from Cdk7 and of the network from Trp53, the
G0 course dataset and the G1/S course dataset obtained from
MEFs treated with serum starvation or hydroxyurea were
used, respectively. This analysis method can predict both the
strength of the relationships between genes and the posterior
distribution of parameters in the log-linear model [22, 23].
Of the 10 genes associated with Cdk7, 9 had some posterior
densities that did not include 0, suggesting very significant
associations (Table 4). Only Il1a included 0 in the posterior
density, with 18% of the distribution above zero and 82%
below. This finding suggested a statistically marginal down-regulation.
Fig. (4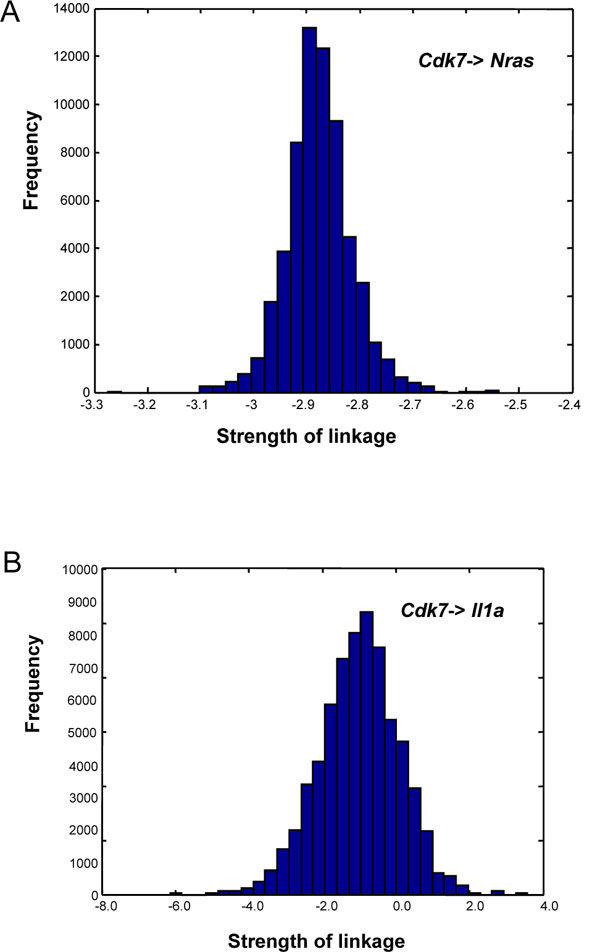 ) illustrated the distribution for a strong
down-regulation (Cdk7 → Nras) and for a weak down-regulation
(Cdk7 → Il1a). A negative association between
Nras and Cdk7 has been reported previously [28], suggesting
that the method we employed in our present analyses can
extract negative relationships between two genes using
simple microarray data.
) illustrated the distribution for a strong
down-regulation (Cdk7 → Nras) and for a weak down-regulation
(Cdk7 → Il1a). A negative association between
Nras and Cdk7 has been reported previously [28], suggesting
that the method we employed in our present analyses can
extract negative relationships between two genes using
simple microarray data.
 |
Fig. (4) (A, B) Frequency histograms approximating the posterior
distributions for linkages from Cdk7 to Nras (a statistically
significant downregulation) and Cdk7 to Il1a (marginally
significant downregulation). Histograms were derived by Bayesian
analysis of the gene interaction network shown in Fig. (2C |

In the G1/S network, Trp53 suppressed the expression of Cdk7 and Rbl2, and stimulated that of Abl1, Il1a, Nmyc, Elk1, Ret and Thra (Fig. 3E). Trp53 has previously been shown to negatively regulate cyclinD/CDK4, cyclinD/ CDK6, cyclinB/cdk2, and cyclinA/cdk2 through the activation of p21 in normal cells. CyclinD/CDK4/6 on the other hand activates phosphorylated RB (pRb) which leads to the activation of E2F, which in turn negatively regulates p53 through p19ARF activation and MDM2 suppression [1, 29]. The interaction between p53 and c-Abl is known to play a critical role in the cell growth and G1 arrest response to DNA damage under normal conditions [30]. It has been reported that CDK7 phosphorylates other CDKs, which is an essential step for their activation [31] and that a direct involvement of p53 in triggering growth arrest by its interaction with the CDK activating kinase complex [32]. These reports and our predictive network suggest therefore that CDK7 is essential for mitosis.
Detection of Gene Networks Using a Recombinant Mouse CDK7 Retrovirus System
Our cell cycle network data indicated that CDK7 activation negatively regulates the expression of Egfr and Nmyc1 in MEFs. To validate this observation, we introduced mouse CDK7 into these cells using a recombinant retrovirus system to evaluate negative regulation of CDK7 against EGFR and N-MYC. The titer of the retrovirus obtained from PT67 producer cells was 4.0 X 10⁹ virus copies/ml for the LXIN empty vector and 5.4 X 10⁹ virus copies/ml for the CDK7 recombinant retrovirus. The hemagglutinin (HA) protein tag was added to the carboxyl terminus of recombinant CDK7 so that we could distinguish the recombinant protein from its endogenous counterpart.
As shown in Fig. (5 ), western blot detection with a HA antibody revealed the expression of recombinant CDK7 protein in infected MEF cells. Increased levels of total CDK7 protein (endogenous plus recombinant CDK7) was also confirmed by immunoblotting with a CDK7 antibody (Fig. 5A). The EGFR, N-MYC1 and c-FOS protein levels detected by western blot were decreased in MEF cells infected with the CDK7-expressing retrovirus when compared with the control cells (Fig. 5A). c-FOS was used as control because there was no direct linkage between CDK7 and c-FOS (see Fig. 2A). The average levels of EGFR and N-MYC1 from three separate experiments are shown in Fig. (5B). Decreased EGFR and N-MYC1 but not c-FOS protein levels indicated that the exogenous introduction of CDK7 negatively influenced their expression. From these results, we concluded that one part of our newly detected cell cycle network had been validated.

DISCUSSION
Gene set enrichment is one means of providing reliable information about specific basic biological processes and has been the most widely used gene-set analysis method to date [33-36]. Directed graphical models known as Bayesian networks, and the MCMC method of determining network inference, have been show to be promising approaches to obtaining new information about gene networks in various tissues and cells.
In our current study, we adopted an approach based on a systematic analysis of gene expression data to define a gene regulatory network and new putative CDK7 functions were identified by quantifying the dynamics of the gene regulatory networks for cell cycle control in MEF cells. A previous study has suggested that a TFIIH complex containing CDK7 is responsible for the phosphorylation of CDK2 and CDK4, both of which are crucial contributors to the G1/S cell cycle transition in human and mouse cells [37]. One of the TFIIH components critically regulates the CAK activity of CDK7 during mitotic progression, suggesting that mitotic silencing of basal transcription is important to the Drosophila cell cycle [38]. The previous study indicated that the phosphorylation of CDK7 cause the inhibition of TFIIH-associated kinase and transcriptional activity [39]. Although we do not have any data about the phospholylation status of introduced recombinant CDK7 protein, there is a possibility that the extra amount of CDK7 protein resulted in the reduced transcriptional activity of TFIIH. The gene networks found in this study have to be further evaluated in terms of whether they are based on direct or indirect interactions, however, this is to our knowledge the first report showing the importance of CDK7 associated networks for the progression from G0 to G1.
We also analyzed gene networks associated with S phase and M phase, in addition to the progression from G0 to G1, which focused in our current linkage analysis. Several central nodes were detected but their networks will need to be further evaluated experimentally, as shown for CDK7 in this study. We thus reveal that the qualitative algorithm based on Bayesian networks is a useful tool for detecting gene networks that function at specific phases of the cell cycle. Our results indicate that CDK7 negatively regulates EGFR and N-myc expression to control G1 entry. When the MEF cells do enter G1 from G0, the expression of Cdk7 is suppressed, resulting in the increased expression of the Egfrand N-myc genes and protein products. EGFR is known act as a growth factor receptor, and activated EGFR is known to promote cell cycle progression through the G1-related Cyclin complex. N-myc is also known to stimulate cell proliferation and CDK7 thus appears to act as a negative regulator of cell proliferation and cell cycle progression in mammalian cells.
Although the CAK activation at the G1/S phase transition promotes mitotic progression, the relationship between Cdk7 and Egfr was observed at the G0/G1 phase but not the G1/S phase in our case. When we looked for the relationship between two genes at the database GEO (http://www.ncbi.nlm.nih.gov/sites/GDSbrowser) for confirming our data, the relationships are reversal at the early stage after several treatments of serum starvation, cat or Camptothecin. This public evidences can support our data, implicating that CDK7 regulates EGFR expression levels according to the type of cell cycle stage.
Our study detected the gene networks from CDK7 to the downstream. As the next step for the study, these inhibitory effects would be needed to analyze from the viewpoint of kinetics. The kinetics study would explore how fast the transcriptional inhibition reaches to the equilibrium in the process of the cell cycle. The time course analysis with the efficient inducible expression system of recombinant CDK7 would be required to get these data.
Whereas our overall approach in this study was based upon a specific set of tools, other tools could be used to obtain similar findings. Gene ontology was used to select specific genes to consider when defining the network. Other classification methods however, such as clustering, could have also been used to select a specific gene group. Sequence/structure analysis of transcription factors in order to verify gene nodes could be replaced by analyses of protein structure, protein-protein interactions, or protein-DNA interactions. The log-linear mathematical model used to quantify gene interactions could easily be replaced by mechanism-based dynamic models if the data could support more parameters. However, the simplicity of the model used in this analysis has the advantage of providing rapid identification of gene relationships that are helpful in elucidating the structure and dynamics of the gene network using only gene expression profiles. With only one parameter in the model for each gene-gene relationship, one can more easily visualize and understand complex network relationships.
We validated part of our predicted network with a retrovirus CDK7 expression system. The exogenous introduction of mouse CDK7 into MEF cells caused a decrease in the protein levels for EGFR and N-MYC1. These findings provided supporting evidence for the validity of our detected gene network. The molecular weight of the retroviral CDK7 was slightly higher than the endogenous protein in mouse MEF cells. According to the Genbank database, there is an alternative splice site at the position of exon 6 in CDK7 (accession number: NM_009874.3). Although our cloned CDK7 is the most common form (346aa, 38.9kDa, accession number: NM_009874), and was mainly used in previous functional studies, there is a possibility that endogenous CDK7 expressed in MEF cells is a short form of this protein that arises through the alternative splicing of exon 6. We predict that there is no functional difference between the short form of CDK7 and our recombinant version, since the binding site of MAT7 and phosphorylation sites are present in both forms.
To further test the negative regulatory relationship between CDK7 and EGFR or N-MYC, we attempted to knockdown endogenous CDK7 using a siRNA approach and also a Cre-loxP mediated conditional expression system. However, neither approach was successful in the MEF cells due to a low transfection efficiency for siRNA and the cell toxicity of the adenovirus which expresses the Cre recombinase.
Another important factor to consider is the condition of the MEFs. We used cells that were not immortalized, which allowed us to investigate gene network dynamics in a normal cell context. However, such cells are severely limited in their replicative capacity, resulting in a limited number of applicable approaches for genetic manipulation. Since the inactivation of both p16 and p53 has previously been reported to be essential for the immortalization of MEFs, it is almost certain that the entire cell cycle network would be severely affected by the immortalization process.
An important objective in Bayesian network learning is to infer the network topology. We used 39 genes based on MAP criterion in this study. Even with 39 genes, the topology space is 2^39. However, it is difficult (virtually impossible) to conclude that the optimized network is the best one without doing all possible topologies, an impossibility for 239 topologies. Therefore, a search algorithm, described with step-by-step instructions in the previous work [21], was used to obtain a network topology. Also in the previous work [21], a series of simulation studies were undertaken to address the operating characteristics of the algorithm and to determine the conditions under which it would fail. The analysis used a simple log-linear model to infer linkages in the network. The approach used has advantages and disadvantages over other approaches. The major advantage is a compact parameter space using the minimum number of parameters to infer the network that allows us to use a single parameter to infer the strength of a linkage. This also reflects on the major disadvantage in that is not possible to use this model to describe the dynamics of the interactions per se as such a mechanistic model would require more complex biomathematical descriptions of each linkage and considerably more data. That said simple linear models have been a mainstay of descriptive statistical evaluations of biological data for decades. In this case, they allow us to test the hypothesis of no linkage between genes against the alternative of a proportionate change on a log-scale and infer linkage.
The analysis tool used here is able to find genes that appear to be positively or negatively correlated as the gene expression patterns change over time. If a gene is only changed at one time, say 6 hours, and its target genes are only altered at a different time, say 12 hours, this algorithm would be unlikely to identify the linkage. A dynamic model, describing the patterns over time in a more mechanistic fashion, might locate such a linkage, although it might still be very difficult. For the data being examined here, it is more likely that the dynamic changes in gene expression occur gradually throughout the course of the experiment (18-24 hours) resulting in correlations through time that can be observed in our simple linear model.
In summary, the results of our network analyses have raised a number of new possibilities concerning the roles of numerous genes in the regulation of the murine cell cycle. The limitations of these analyses (use of only microarray data, a simple log-linear model, and promoter region sequences) preclude a stronger interpretation of the results. However, as additional data are obtained in future studies that address the hypothetical linkages identified by our findings, it should be possible to bring them formally into an improved analysis and critically evaluate each linkage in greater detail. This is the overall goal of cancer systems biology and the general approach presented here should form the basis for future attempts at system-wide analyses of biological function.
SUPPLEMENTAL MATERIALS
This article also contain supplementary material and it can be viewed at publisher’s website along with the article.
ACKNOWLEDGEMENTS
We thank Leping Li, Delong Liu, Rick Paules, David Umbach, Scott Auerbach and Ben Van Houten (NIH/NIEHS) for their comments on this work, and J. R. Nevins and S. Ishida for kindly providing the original dataset. This research was supported in part by the National Institute of Environmental Health Sciences.