- Home
- About Journals
-
Information for Authors/ReviewersEditorial Policies
Publication Fee
Publication Cycle - Process Flowchart
Online Manuscript Submission and Tracking System
Publishing Ethics and Rectitude
Authorship
Author Benefits
Reviewer Guidelines
Guest Editor Guidelines
Peer Review Workflow
Quick Track Option
Copyediting Services
Bentham Open Membership
Bentham Open Advisory Board
Archiving Policies
Fabricating and Stating False Information
Post Publication Discussions and Corrections
Editorial Management
Advertise With Us
Funding Agencies
Rate List
Kudos
General FAQs
Special Fee Waivers and Discounts
- Contact
- Help
- About Us
- Search


The Open Condensed Matter Physics Journal
(Discontinued)
ISSN: 1874-1924 ― Volume 4, 2013
Effective Linewidth in Raman Spectra of Titanium Dioxide Nanocrystals
M Salis1, P.C Ricci*, 1, A Anedda1, 2
Abstract
Raman spectra of nanocrystals titanium dioxide are discussed and the correlation between the band shape of the allowed A1g Raman mode and the crystals dimensions is discussed. Data on Raman spectra are reconsidered in the framework of a modified "hard confinement" model (MHC). The proposed model is based on the idea of using an effective linewidth parameter, which is a function of the effective dimension of the nanostructure, in spite of the intrinsic Raman band linewidth.
The comparison with standard hard confinement model reveals better agreement with the experimental results for the MHC model up to 6 nm. Moreover, the analysis permits to improve the knowledge of the phonon dispersion curve as well as the intrinsic Raman bulk parameters. An analytical form of the size-dependent peak-position in nanocrystals, useful for an approximated size estimation, has been explicated. The general structure of the model permits to extended the MHC to other nano-sized materials.
Article Information
Identifiers and Pagination:
Year: 2009Volume: 2
First Page: 15
Last Page: 18
Publisher Id: TOCMPJ-2-15
DOI: 10.2174/1874186X00902010015
Article History:
Received Date: 10/10/2008Revision Received Date: 06/4/2009
Acceptance Date: 6/4/2009
Electronic publication date: 28/4/2009
Collection year: 2010
open-access license: This is an open access article licensed under the terms of the Creative Commons Attribution Non-Commercial License (http://creativecommons.org/licenses/by-nc/3.0/) which permits unrestricted, non-commercial use, distribution and reproduction in any medium, provided the work is properly cited.
* Address correspondence to this author at the Department of Physics, University of Cagliari, s.p. 8 Km 0.7, 09042 - Monserrato, Cagliari, Italy; E-mail: carlo.ricci@dsf.unica.it
| Open Peer Review Details | |||
|---|---|---|---|
| Manuscript submitted on 10-10-2008 |
Original Manuscript | Effective Linewidth in Raman Spectra of Titanium Dioxide Nanocrystals | |
INTRODUCTION
Agglomerates of nanosized TiO2crystals are promising materials for electrochemical, photochemical and photovoltaic applications [1-4]. Among the several techniques used to characterize these materials, Raman spectroscopy plays a special role in the investigation of size effects on crystal vibrational properties in the nanometer scale. Depending on the crystal size nanocrystals undergo strain or non-stoichiometry which can significantly affect the Raman spectra [3, 4]. Several reports on titanium dioxide nanocrystals show that Raman shift in this material is mainly due to phonon confinement (PC) effect [1-3]. Different confinement models have been used to fit experiments with alternate successes [1-4], where the main difficulties in matching experiments can be ascribed to model oversimplifications. In this connection, it has been shown that by using the proper model parameters it is possible to greatly improve fits of theoretic Raman spectra to experimental peak-shapes [5]. These results have been obtained by modifying the "hard confinement" (HC) model, where the intrinsic Raman linewidth is replaced by a proper effective one. The latter may be affected by several unpredictable effects such as interactions between defects and band modes [6], changes of the anharmonic coupling factors [7], anisotropy [8, 9] and/or phase mixing [3]. Besides, although Raman spectra are surely subject to PC effects, they can show structures significantly scattered from the predictions based on the ideal PC problem. This difference may raise from the proper figures of the effective linewidth parameter utilized in PC models.
Early and recent data are investigated in this paper. Our goal is to show that for TiO2 nanocrystals the variations in Raman-peak positions due to the occurrence of linewidth broadening should be accounted for by the modified HC (MHC) model. In Section 2 a curve model for the size-dependent effective linewidth will be derived on from the averaged anisotropy function [8, 9]. This allows an approximated analytical form of the peak-position dependence on particle size that features all the relevant parameters. Deviations of the experimental figures from model predictions are further considered in Section 3.
MODEL SETTINGS
In a perfect infinite crystal only phonons close to the center of the Brillouin zone (BZ) contribute to inelastic scatterings of incident radiations. When crystal sizes range in the nanometer scale, a larger portion of the BZ is allowed to effectively participate in scattering processes due to weakening of the rule q0≈0 [10, 11]. The extension of such a region in the quasi-momentum space is determined by the confinement of the q0=0 phonon wave function [11, 12]. Formally, this can be explained by considering the modulation of the phonon wave function in the infinite crystal with a suitable "weighting" function [11]. It is possible to calculate the first-order Raman spectrum of nanosized crystals on expansion by Fourier integrals (except for a constant factor) from
where C(q) stands for Fourier coefficients of the q0=0 phonon wave function,ω for the phonon dispersion curve and Г0for the intrinsic Raman band linewidth [11]. Some simplifications are required to handle eq. (1). A drastic but commonly accepted assumption considers an isotropic dispersion in a spherical BZ [11] and the function ω(q) represents an averaged dispersion curve [13]. As for phonon confinement (PC), the model which received the most credit assumes a Gaussian weighting function (hard confinement, HC) for spherical nanocrystals [1, 2, 8, 9, 13].
Accordingly, eq. (1) can be rewritten as
where L is the correlation length in the crystal, which can be assumed as the diameter of the nanoparticles, and “a” stands for the lattice parameter.
From the numerical inspection of eq. (2) it can be found that, as long as the quadratic approximation
where
where sgnA stands for the sign of A. The latter equation clearly shows that linewidth can become important in determining the peak position when the size of nanocrystals ranges within a few nanometers (for example, if L=12axthen
Previous works propose to replace the effective linewidth Г0 with a function
In order to account for quasi-momentum dependence in Г(q) we propose to consider the function as
which presents the same analytical structure as
The working hypothesis is
where the dependence on crystal size of Fourier coefficients has been explicated.
When crystal size is sufficiently larger than crystal parameter a, it is possible to calculate the integrals in eq. (6) extending the upper limit to infinity:
where is to be estimated from comparison with experiments and
RESULTS AND DISCUSSION
In Fig. (1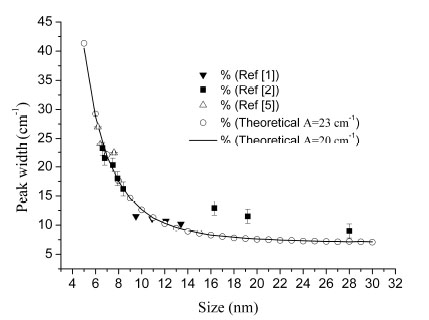 ) data on peak-widths are reported from refs. [1, 2, 5]. The peak-widths calculated from the MHC model by using eq. (7) in eq(2) are reported as well (solid curve). According to refs [1, 2, 5], the dispersion curve used for the calculations in case of Anatase phase is:
with
Peak positions were calculated by using the “anatase” values”: and the results are shown in Fig. (2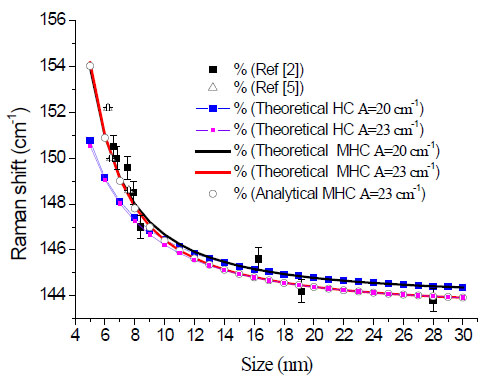 , black solid curve obtained from eq. 2) in which Гo is replaced by Г Г(L)where, by comparison, the curve predicted by the non-modified HC model is reported as well (blue solid curve obtained from eq. 2).
The curves obtained from the two model are very similar at large nanoparticle dimensions (about 12 nm), while sensible differences appear where phonon confinement effect plays a major role. In this range the MHC model fits the experimental result much better than the HC model (Fig. 2). However, it is worth pointing out that both the models do not fit adequately the experimental data for particles of large dimensions, where the choice of the intrinsic Raman bulk parameters and the phonon dispersion curve are critical. Therefore the fit has been performed with small variation in the phonon dispersion curve parameters (eq. 8); the best result has been obtained for:).
 |
Fig. (1) Experimental and theoretical peak-widths. The latter were calculated by replacing the intrinsic linewidth with the effective one defined in eq. (7). |
From comparison of data shown in Fig. (2) we note the presence of some discrepancies between model predictions and experiments that cannot be explained by linewidth broadening. Thus, to go deeper into this analysis, it is convenient to make an estimation, even though rough, of the behaviour of A (to avoid confusion, it will be referred to as AR) as a function of the nanoparticle dimension. This can be made by taking into account that when peak-width is large the peak shape features an almost Lorentz-shaped. Thus, we retrieved the searched-for parameters by fitting the MHC model to the Lorentz-like curves having the actual Raman peak-widths and -positions. This was done by using a standard Levenberg-Marquardt procedure [5, 15]. As for data in ref [5] we are able to report the fit results of the actual Raman curves. To simplify the discussion all the retrieved parameters are obtained only for the case

It is worth pointing out that in spite of the effective linewidths, which appear to increase almost monotonically as crystal size decreases, parameter AR shows a non-regular behaviour dependent on the actual sample. However, its value oscillates, sample by sample, around which is the expected value from the chosen
Besides, the results show light deviation from sample to sample, and this work points out that an effective linewidth parameter, which is function of the dimension of the nanostructure, should be considered for a correct interpretation of nanoparticle Raman spectra. The model has been applied only on titanium dioxide nanocrystals but can be extended to other nano-sized materials. Further analysis on other materials are a mandatory task.
CONCLUSIONS
A modified hard confinement model has been proposed. We have shown that for a better matching of the HC model with Raman spectra of nanocrystals a suitable definition of an effective linewidth is required. The model is focused on the replacement of the intrinsic Raman linewidth in the HC model with a function of the actual dimension of the nanostructure. The model has been successfully applied to titanium dioxide nanocrystals and further information about the phonon dispersion curve has been obtained. An analytical form of the developed model, useful for a approximated size estimation, has been explicated.