- Home
- About Journals
-
Information for Authors/ReviewersEditorial Policies
Publication Fee
Publication Cycle - Process Flowchart
Online Manuscript Submission and Tracking System
Publishing Ethics and Rectitude
Authorship
Author Benefits
Reviewer Guidelines
Guest Editor Guidelines
Peer Review Workflow
Quick Track Option
Copyediting Services
Bentham Open Membership
Bentham Open Advisory Board
Archiving Policies
Fabricating and Stating False Information
Post Publication Discussions and Corrections
Editorial Management
Advertise With Us
Funding Agencies
Rate List
Kudos
General FAQs
Special Fee Waivers and Discounts
- Contact
- Help
- About Us
- Search


The Open Cybernetics & Systemics Journal
(Discontinued)
ISSN: 1874-110X ― Volume 12, 2018
A GIS-based Statistics and Evaluation System of Urban Planning
Zhong Tong1, Qiuwen Zhang1, *, Jianfeng Zhu1, Xiaofei Liu1, Fei Yan1
Abstract
Urban planning statistics and evaluation is necessary for healthy and sustainable development of cities. However, it is not an easy task to perform statistics and evaluation because of the complexity of urban planning and the various involved data. In this paper, a GIS-based statistics and evaluation system is proposed to meet the unique requirements of the system, including multiple data type, abundant spatial data and high usage frequency. In the GIS-based system, four main function modules are designed to help statistics and evaluation on different aspects of urban planning. Finally, the system is developed based on the designed scheme and applied to urban planning routine work in Fengfeng Mining District in China. The application results show that the proposed urban planning statistics and evaluation system is capable of statistics and evaluation for urban planning in a comprehensive and convenient way.
Article Information

Identifiers and Pagination:
Year: 2016Volume: 10
First Page: 91
Last Page: 100
Publisher Id: TOCSJ-10-91
DOI: 10.2174/1874110X01610010091
Article History:
Received Date: 9/11/2015Revision Received Date: 6/4/2016
Acceptance Date: 21/4/2016
Electronic publication date: 15/07/2016
Collection year: 2016
open-access license: This is an open access article licensed under the terms of the Creative Commons Attribution-Non-Commercial 4.0 International Public License (CC BY-NC 4.0) (https://creativecommons.org/licenses/by-nc/4.0/legalcode), which permits unrestricted, non-commercial use, distribution and reproduction in any medium, provided the work is properly cited.
Correspondence: Address correspondence to this author at School of Hydropower and Information Engineering, Huazhong University of Science and Technology, 1037 Luoyu Road, Wuhan, China; E-mail: qwzhang_hust@163.com
| Open Peer Review Details | |||
|---|---|---|---|
| Manuscript submitted on 9-11-2015 |
Original Manuscript | A GIS-based Statistics and Evaluation System of Urban Planning | |
1. INTRODUCTION
Urban planning, covering the fields of comprehensive deployment of urban future development, urban spatial layout and various urban constructions, is important to urban development [1I. Bracken, Urban Planning Methods: Research and Policy Analysis, Routledge: Abingdon, 2014.]. However, many uncertain factors and challenges exist in the process of urban development, resulting in a worrying situation that many cities don't develop as the previously made plans especially in developing countries like China, Brazil and Malaysia [2S. Feng, and L. Xu, "Decision support for fuzzy comprehensive evaluation of urban development", Fuzzy Sets Syst., vol. 105, pp. 1-12, 1999.
[http://dx.doi.org/10.1016/S0165-0114(97)00229-7] , 3S. Feng, and L. Xu, "An intelligent decision support system for fuzzy comprehensive evaluation of urban development", Expert Syst. Appl., vol. 16, no. 1, pp. 21-32, 1999.
[http://dx.doi.org/10.1016/S0957-4174(98)00028-1] ]. Under the circumstances, statistics and evaluation of urban planning is urgently needed to provide an approach for city managers to grasp a comprehensive situation of urban development.
Prosperous studies have provided insights into the theme of urban planning statistics and evaluation: at the earliest, a statistics and evaluation of land use plan was carried out for Krayot area in Israel [4R. Alterman, and M. Hill, "Implementation of urban land use plans", J. Am. Inst. Plann., vol. 44, pp. 274-285, 1978.
[http://dx.doi.org/10.1080/01944367808976905] ]; the wetland development was evaluated by comparing the actual land use with the land use plans design 10 years before [5S.D. Brody, and W.E. Highfield, "Does planning work?: Testing the implementation of local environmental planning in Florida", J. Am. Inst. Plann., vol. 71, pp. 159-175, 2005.
[http://dx.doi.org/10.1080/01944360508976690] ]; the implementation of local land use policies for hurricane hazard zones was evaluated in Florida based on Geographic Information System (GIS) [6T.S. Chapin, R.E. Deyle, and E.J. Baker, "A parcel-based GIS method for evaluating conformance of local land-use planning with a state mandate to reduce exposure to hurricane flooding", Environ. Plann. B, vol. 35, pp. 261-279, 2008.
[http://dx.doi.org/10.1068/b32114] ]. Although these studies provided different methods for statistics and evaluation of urban planning, only a facet of urban planning such as land use or public facilities was considered. A comprehensive statistics and evaluation of urban planning was not properly addressed in the previous researches, for the reasons that urban system is a complicated system covering various aspects, the data involved in urban planning is multisource and heterogeneous, and a large amount of spatial and non-spatial data are difficult to be managed in traditional Management Information System (MIS) [7M. Turoff, M. Chumer, B. Van, and X. Yao, "The design of a dynamic emergency response management information system (DERMIS)", J. Inform. Technol. Theor. Appl., vol. 5, no. 4, pp. 1-36, 2004., 8M. Batty, and P. Densham, "Decision support, GIS and urban planning", Sistema Terra, vol. 5, no. 1, pp. 72-76, 1996.]. So it is quite necessary to design and implement a specialized statistics and evaluation system for urban planning.
Considering the difficulties of statistics and evaluation of urban planning, in this paper, we propose a statistics and evaluation system customized for urban planning based on GIS. In the GIS-based system, the complicated urban planning is decomposed into many elements which are easier to be tackled and GIS is adopted to handle the elements involved with spatial data.
2. REQUIREMENTS ANALYSIS
It's widely acknowledged that data is the basic and key point for a statistics and evaluation system. Considering that urban planning data is quite different compared with other general data, the characteristics of statistics and evaluation system should be analyzed in detail before the design of urban planning statistics and evaluation system.
2.1. System Characteristics
(1) The type of data is various and the amount of data is extremely large in urban planning.
The data needed for urban planning and produced through urban planning process could be categorized as actual data, planning data, business data, documents and other data including multimedia data, 3D data and metadata. A large volume of data is difficult to be stored and managed and a variety of data type makes data analysis never an easy work. So it is tough to carry out statistics, analysis and evaluation based on such data.
(2) According to relevant statistical data, more than 80% of existing data is spatial data, also referred to as geospatial data or geographic information.
In the field of urban planning, the portion of spatial data is even larger. Spatial data is not easy to be stored, managed, displayed or analyzed, for it relates to topological, geometric and geographic properties. The traditional MIS and universal statistical software are no longer valid to handle spatial data.
(3) Besides the characteristics of urban planning data, urban planning statistics and evaluation is conducted in a high frequency to make sure that cities develop as the instructions in urban plans.
Frequent statistics and evaluation of urban planning is beneficial for urban managers to find out the deviation of actual urban development from urban development plans. Once deviation is observed through statistics and evaluation, measures of remediation should be taken timely to prevent improper and illegal urban development.
2.2. System Requirements
The characteristics of urban planning statistics and evaluation system have been thoroughly analyzed, so the unique characteristics might lead to corresponding special requirements for the proposed statistics and evaluation system. The requirements are listed as follows:
(1) Considering the volume and type of urban planning data, it is impossible to store the data in a stand-alone computer. A more practical solution is to introduce a database system to better manage the urban planning data, which makes it more efficient to access the data. Besides, the data is more secure and convenient to be shared among different urban management departments when stored in a database. So an interface to interact with an urban planning database is absolutely necessary for the urban planning statistics and evaluation system.
(2) GIS is a computer system for spatial data storage, management, display and analysis. It is originated from the Canada Geographic Information System (CGIS) and has been widely used by geographers, economists and environmentalists to deal with spatial data. Therefore, GIS should be integrated into the urban planning statistics and evaluation for its superiority in spatial data management, spatial statistics and spatial analysis.
(3) Allowing for the high utilization frequency, all of the functions, relating to statistics, evaluation and some auxiliary functions should be integrated into one system to make the process of statistics and evaluation more efficient and convenient. That is to say, a thematic statistics and evaluation system customized for urban planning is urgently needed to be designed and developed.
3. DESIGN OF STATISTICS AND EVALUATION SYSTEM OF URBAN PLANNING
3.1. General Structure Design
Since the operating environment of urban planning statistics and evaluation system is always fixed and data transmission volume is large, a C/S (Client /Server) mode, which is suitable for a high level security requirement, large data volume and stable local area network situation, is adopted as the general structure of the system. The structure is shown in Fig. (1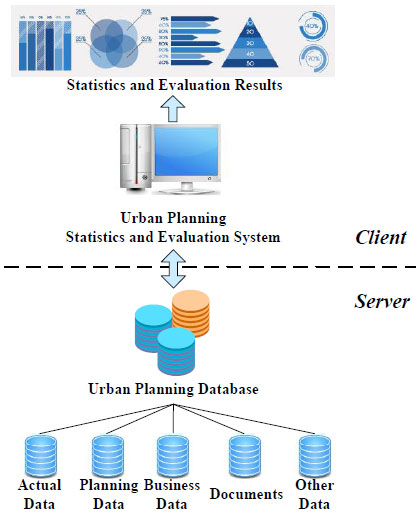 ).
).
 |
Fig. (1) General structure of urban planning statistics and evaluation system. |
In C/S mode, the urban planning database works as a server and the proposed urban planning statistics and evaluation system serves as a client. As a server, the database provides necessary data related for the system to make analysis and the statistics and evaluation results could also be stored in database for later usage. While as a client, the urban planning statistics and evaluation system needs all kinds of data intensively managed in the urban planning database to realize statistics and evaluation of urban development.
3.2. System Modules Design
The urban planning statistics and evaluation system is composed of four main modules including basic GIS module, business data statistics and evaluation module, spatial form statistics and evaluation module, land use statistics and evaluation module (Fig. 2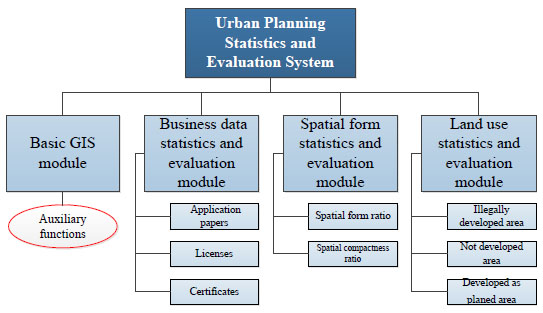 ). The functions of each module are analyzed in detail as follows:
3.2.1. Basic GIS Module
Considering there is a very high operation frequency of spatial data processed in the system, the basic GIS module is designed to facilitate the pre-process and analysis of spatial data. The basic GIS functions are spatial data import and export, display, query, spatial statistics and analysis. Packing the functions into an auxiliary GIS module could very helpful to assist the statistics and evaluation implemented in other modules.
 |
Fig. (2) The modules of the urban planning statistics and evaluation system. |
3.2.2. Urban Planning Business Data Statistics and Evaluation Module
As is known to all that urban construction is the driving force of urban development. In order to manage the urban development, the urban construction should be strictly supervised. The important information in construction application papers, licenses and certificates are commonly organized by urban management department and stored in urban planning database as business data. Analysis of business data, according to selected criteria such as time interval, construction type, land use type, approval status, is the main work of urban planning business data statistics and evaluation module.
3.2.3. Spatial form Statistics and Evaluation Module
Spatial form is a key factor for urban planners and urban managers to consider when urban plans are made. A suitable spatial form is not only favorable to urban development but also convenient for citizens to participate in social activities like work and entertainment.
Urban spatial form could be characterized by two indexes: spatial form ratio and spatial compactness ratio.
(1) Spatial form ratio
Spatial form ratio is proposed by Horton and it is calculated as follows:
 |
(1) |
where A is the area (m2) of built-up area and L is the length of major axis of built-up area. If the value of spatial form ratio is relatively small, it suggests that urban buildings are distributed in a strip shape, that is to say the internal communication among the area is inconvenient. Built-up areas with different spatial form ratio are shown in Fig. (3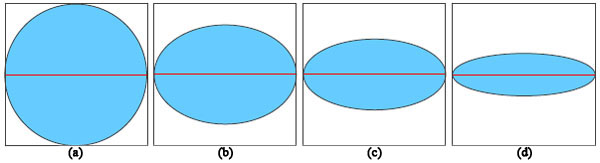 ). The blue areas are built-up areas and the red lines are the corresponding major axes. The spatial form values of the four built-up areas in Fig. (3a-d) are 0.785, 0.550, 0.379 and 0.236 based on Horton’s spatial form ratio equation in Eq. (1).
 |
Fig. (3) Diagram of built-up areas with different spatial form ratio. |
Horton’s spatial form ratio considers the area and the major axis length of built-up area. Although the method is simple, it isn’t applicable to all cases. Considering the situation in Fig. (3), the built-up areas and major axes of Fig. (4a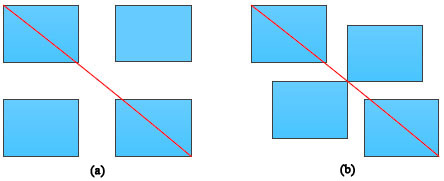 and b) are the same, so the values of Horton’s spatial form ratio are equal. However, it is easy to find out that the built-up area in Fig. (4b) is more narrowly distributed than that in Fig. (4a) by observing Fig. (4). So Horton’s spatial form ratio method is invalid in some situations.
 |
Fig. (4) Diagram of built-up areas with same spatial form ratio. |
In this paper, a modified method is introduced to calculate spatial form ratio to better adapt to GIS and to reduce the calculation procedure and time. The defined spatial form ratio is computed as follows:
 |
(2) |
where a and b are respectively the semi major axis and semi minor axis of a standard deviational ellipse which is drawn based on the built-up area in GIS to reflect the directional distribution. It could be observed that Form ratio ≥ 1 and the larger the form ratio is, the more zonally the buildings are distributed.
(2) Spatial compactness ratio
Different methods have been proposed to measure the compactness of an area and the equation put forward by Cole is the most widely used one. Cole's spatial compactness ratio is calculated as:
 |
(3) |
where A is the area of built-up area and A′ is the area of the circumcircle of the built-up area. It is obvious that spatial compactness ratio is equal to or smaller than 1. When it is equal to 1, it is the most compact situation where the outline of built-up area is a circle and the circle is fully filled with buildings. Diagram of built-up areas with different spatial compactness ratio is shown in Fig. (5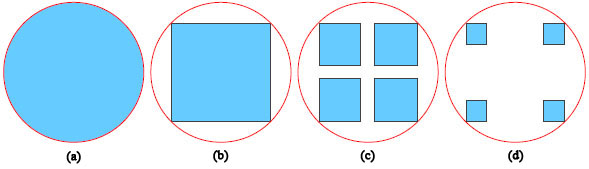 ). The blue areas are built-up areas and red circles are circumcircles of the built-up areas. So the spatial compactness ratios of Fig. 5 (a-d) are 1, 0.624, 0.459 and 0.115 respectively.
 |
Fig. (5) Diagram of built-up areas with different spatial compactness ratio. |
3.2.4. Land Use Statistics and Evaluation Module
Land use situation could be obtained by the analysis between two spatial layers which represent the urban land use plan and actual land use. Based on spatial analysis of the two layers, illegally developed area, not developed area and developed as planed area could be discovered. The result of an intersection analysis is the area developed as previously made plans, while the illegally developed area and not developed area are respectively detected by an erase analysis of actual development layer being erased by land use plan layer and an erase analysis of land use plan layer being erased by actual development layer.
4. SYSTEM DEVELOPMENT AND APPLICATION
To test the feasibility and practicability of the designed statistics and evaluation system of urban planning, the system are developed based on Microsoft Visual Studio platform and ESRI ArcGIS Engine. The main interface is shown in Fig. (6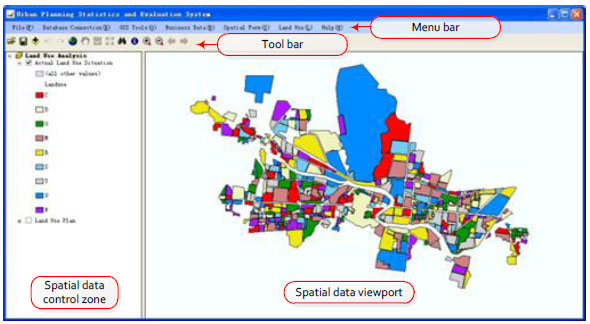 ).
).
 |
Fig. (6) Main interface of urban planning statistics and evaluation system. |
The spatial data viewport is the main display area for spatial data, including the unprocessed data fetched from urban planning database and the statistics and analysis results produced in the system. The spatial data control zone, in which layer order could be changed, spatial features are labeled and thematic maps are made, is an auxiliary for spatial data display. The system modules are launched on menu bar on the top of the main interface. When a specific module is clicked, a sub interface would appear. On the sub interface, parameters are set and the analysis is activated. The analysis results could be displayed and saved to database at last.
A practical application in Fengfeng Mining District in Hebei Province, China was conducted to test the developed system.
A part of the results of business data statistics and evaluation module are shown in Fig. (7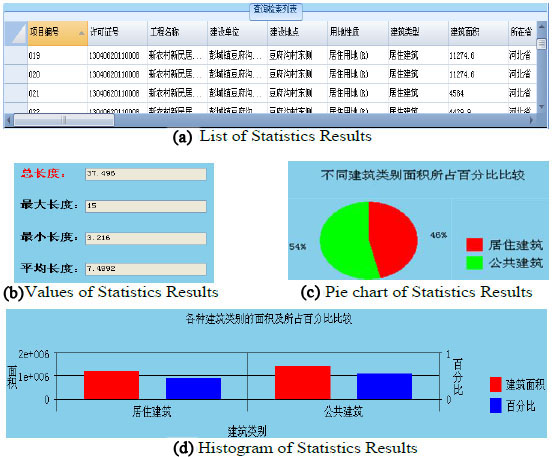 ) in multiple forms such as lists, numerical values, pie charts and histograms. They reflect the details, summary information, percentages and tendency of urban construction obtained from business data.
 |
Fig. (7) Results of business data analysis. |
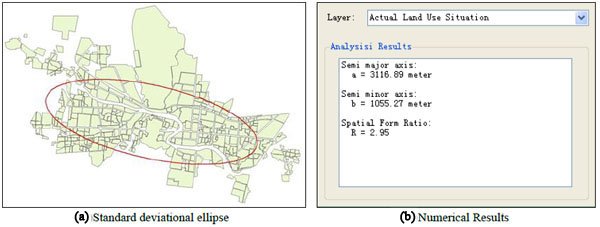 |
Fig. (8) Results of spatial form ratio analysis. |
Spatial form ratio of a selected built-up area is calculated in the system and the results are shown in Fig. (8 ). The red ellipse in Fig. (8a) is a standard deviational ellipse of the built-up area and the numerical results are given in Fig. (8b). The semi major axis is 3116.89 meter and the semi minor axis is 1055.27 meter, so the spatial form ratio of the selected built-up area is 2.95, indicating the urban buildings distribution is zonal and the inter-city communication is moderately inconvenient.
Fig. (9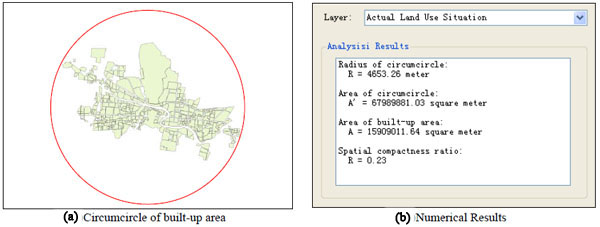 ) shows the results of spatial compactness ratio analysis. The red circle in Fig. (9a) is a circumcircle of the built-up area. The radius of the circle is 4653.26 meter thus making its area is 67989881.03 square meters. Since the area of the built-up area is 15909011.64 square meters, the spatial compactness ratio equals to 0.23, indicating the urban form is loose and many patches of land are left undeveloped.
 |
Fig. (9) Results of spatial compactness ratio analysis. |
To perform land use statistics and evaluation, two layers representing land use plan and actual land use are needed. Fig. (10a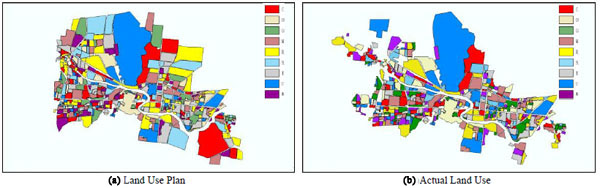 and b) show the layers of land use plan and actual land use respectively and each type of land use is rendered in different color. Analysis between two layers produces the land use statistics and evaluation results, shown in Fig. (11
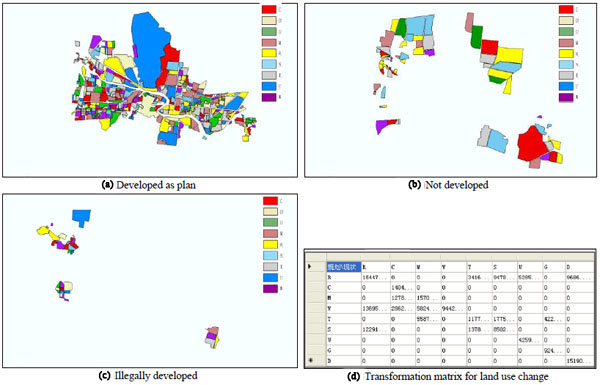 ). The lands which are developed the same as the previous plan are shown in Fig. (11a), while the not developed lands and illegally developed lands are separately given in Fig. (11b and c). Although the shape of land is developed as plans but the land use type might change for example from green land to residential land, so a transformation matrix is given to reflect the land use type change in Fig. (11d). The value of the element aij is the area (m2) of land whose land use type changes from i to j.
 |
Fig. (10) Layer of land use plan and layer of actual land use. |
 |
Fig. (11) Results of land use analysis. |
CONCLUSION
In this paper, we design and develop an urban planning statistics and evaluation system according to the characteristics and requirements. The GIS-based system is generally composed of basic GIS module, business data statistics and evaluation module, spatial form statistics and evaluation module, and land use statistics and evaluation module, which enable the system to comprehensively and conveniently implement urban planning statistics and evaluation based on ordinary date and spatial data. An application is carried out to illustrate and test the system and the results show that the system is feasible, convincing and accurate. So the proposed system could provide useful support information for urban managers to make corresponding decisions to make urban development more reasonable, healthy and sustainable.
CONFLICT OF INTEREST
The authors confirm that this article content has no conflict of interest.
ACKNOWLEDGEMENTS
This study was supported by the Natural Science Foundation of Hubei Province, China (2015CFA134) and the National Natural Science Foundation of China (41072199).
REFERENCES
| [1] | I. Bracken, Urban Planning Methods: Research and Policy Analysis, Routledge: Abingdon, 2014. |
| [2] | S. Feng, and L. Xu, "Decision support for fuzzy comprehensive evaluation of urban development", Fuzzy Sets Syst., vol. 105, pp. 1-12, 1999. [http://dx.doi.org/10.1016/S0165-0114(97)00229-7] |
| [3] | S. Feng, and L. Xu, "An intelligent decision support system for fuzzy comprehensive evaluation of urban development", Expert Syst. Appl., vol. 16, no. 1, pp. 21-32, 1999. [http://dx.doi.org/10.1016/S0957-4174(98)00028-1] |
| [4] | R. Alterman, and M. Hill, "Implementation of urban land use plans", J. Am. Inst. Plann., vol. 44, pp. 274-285, 1978. [http://dx.doi.org/10.1080/01944367808976905] |
| [5] | S.D. Brody, and W.E. Highfield, "Does planning work?: Testing the implementation of local environmental planning in Florida", J. Am. Inst. Plann., vol. 71, pp. 159-175, 2005. [http://dx.doi.org/10.1080/01944360508976690] |
| [6] | T.S. Chapin, R.E. Deyle, and E.J. Baker, "A parcel-based GIS method for evaluating conformance of local land-use planning with a state mandate to reduce exposure to hurricane flooding", Environ. Plann. B, vol. 35, pp. 261-279, 2008. [http://dx.doi.org/10.1068/b32114] |
| [7] | M. Turoff, M. Chumer, B. Van, and X. Yao, "The design of a dynamic emergency response management information system (DERMIS)", J. Inform. Technol. Theor. Appl., vol. 5, no. 4, pp. 1-36, 2004. |
| [8] | M. Batty, and P. Densham, "Decision support, GIS and urban planning", Sistema Terra, vol. 5, no. 1, pp. 72-76, 1996. |