- Home
- About Journals
-
Information for Authors/ReviewersEditorial Policies
Publication Fee
Publication Cycle - Process Flowchart
Online Manuscript Submission and Tracking System
Publishing Ethics and Rectitude
Authorship
Author Benefits
Reviewer Guidelines
Guest Editor Guidelines
Peer Review Workflow
Quick Track Option
Copyediting Services
Bentham Open Membership
Bentham Open Advisory Board
Archiving Policies
Fabricating and Stating False Information
Post Publication Discussions and Corrections
Editorial Management
Advertise With Us
Funding Agencies
Rate List
Kudos
General FAQs
Special Fee Waivers and Discounts
- Contact
- Help
- About Us
- Search


The Open Environmental Research Journal
Formerly: The Open Ecology Journal
ISSN: 2590-2776 ― Volume 16, 2023
- New Journal Website
- Journal Home
- Editorial Board
- Board Recruitment Workflow
- Instructions for Authors
- Plagiarism Prevention
- Fabricating and Stating False Information
- Research Misconduct
- Post Publication Discussions and Corrections
- Allegations from Whistleblowers
- Advertising Policy
- Short Guide
- Editorial Policies
- Publishing Ethics and Rectitude
- Quick Track Option
- Reviewer Guidelines
- Guidelines for Guest Editors
- Publication Fee
- Publication Cycle - Process Flowchart
- Archiving Policies
- Special Issues
CO2 Mitigation in the Power Sector of Thailand: Analyses of Cleaner Supply-side Options Beyond the Paris Agreement
Lyheang Chhay1, Bundit Limmeechokchai1, *
Abstract
Background:
The drastically increasing share of fossil fuel supply to meet the rapidly growing electricity demand resulting in increasing Carbon dioxide (CO2) emissions, is the major concern in Thailand. In 2015, fossil fuels used in electricity generation in Thailand accounted for around 85.3% of the total electricity generation.
Aim:
The aim of the study is to analyze carbon dioxide mitigation options under the cleaner supply-side option beyond the Intended Nationally Determined Contribution (INDC) of Thailand.
Methods:
In this study, the Long-range Energy Planning (LEAP) model is used to analyze the share of electricity generation and CO2 mitigation from four main different scenarios, namely Business-as-Usual (BAU), Renewable Energy (RE), Carbon Capture Storage (CCS), and Carbon Tax (CT) scenarios during 2015 to 2050. The BAU scenario is constructed following the power development targets of the Power Development Plan in 2015.
Results:
The results illustrate that in the BAU scenario, electricity generation and carbon dioxide emissions from the power sector will increase by 57.7% and 37.3%, respectively in 2050 as compared to 2015. The imposition of carbon tax of $20/tCO2 from 2020 and an increase to $500/t CO2 by 2050 will have a high potential to reduce CO2 emissions from the power sector as compared with other scenarios.
Conclusion:
Results show that except for the RE scenarios considering the lower share of solar and biomass, all scenarios would help Thailand in achieving the target of INDC by 2030. Results provide that the share of imported electricity is higher with the imposition of carbon tax as compared to the scenarios with the promotion of renewable energy, CCS and EV technology.
Article Information

Identifiers and Pagination:
Year: 2019Volume: 12
First Page: 15
Last Page: 25
Publisher Id: TOECOLJ-12-15
DOI: 10.2174/1874213001912010015
Article History:
Received Date: 17/07/2019Revision Received Date: 15/10/2019
Acceptance Date: 28/10/2019
Electronic publication date: 05/12/2019
Collection year: 2019
open-access license: This is an open access article distributed under the terms of the Creative Commons Attribution 4.0 International Public License (CC-BY 4.0), a copy of which is available at: (https://creativecommons.org/licenses/by/4.0/legalcode). This license permits unrestricted use, distribution, and reproduction in any medium, provided the original author and source are credited.
* Address correspondence to this author at Sirindhorn International Institute of Technology, Thammasat University Pathum Thani, 12120, Thailand;
Tel: +66894939919; Email: bundit@siit.tu.ac.th
| Open Peer Review Details | |||
|---|---|---|---|
| Manuscript submitted on 17-07-2019 |
Original Manuscript | CO2 Mitigation in the Power Sector of Thailand: Analyses of Cleaner Supply-side Options Beyond the Paris Agreement | |
1. INTRODUCTION
The lack of conventional sources of supplies to achieve developing energy demand is the main problem for all countries. Moreover, many countries modify their plans in order to improve their energy supply by choosing proper renewable energy resources that are delicate to energy price, choosing domestic resources and also considering global environmental issues The development of world energy consumption has grown dramatically as long as the increasing number of populations and social-economic development (OECD/IEA, 2011OECD/IEA. (2011). OECD Green Growth Studies. Energy.) is concerned. Thailand is one of the fast-growing energy-intensive economies in Southeast Asia. Thus, Thailand consumes enormous energy and releases a large amount of GHG emission, especially the energy sector (ONEP, 2018ONEP. (2018). Thailand's third national communication Office of Natural Resources and Environmental Policy and Planning (ONEP)). Thailand is located at the center of peninsular Southeast Asia, with a population of around 68.66 million (2015). Thailand is bordered by Myanmar and the Andaman Sea to the west, Laos to the northeast, Cambodia to the southeast, and the Gulf of Thailand and Malaysia to the south (ADB, 2015Atilgan, B & Azapagic, A (2015) Life cycle environmental impacts of electricity from fossil fuels in Turkey. J Clean Prod, 106, 555-64.
[http://dx.doi.org/10.1016/j.jclepro.2014.07.046] ). In 2015, electricity consumption was 185,572 GWh in Thailand, an increase of 3.6% compared to the previous year. The per capita of electricity consumption in 2015 reached 2,621 kWh/capita. Thus, the electricity generation notably raised in order to fulfill electricity demand. Thailand achieved nearly 100% of household access to the national grid. In terms of electricity generation, the Electricity Generating Authority of Thailand (EGAT) in 2015 provided 38.07% of total energy consumption, whereas 61.93% was generated from domestic private power producers and imported electricity from neighboring countries (EGAT, 2015EPPO. (2015). Thailand Power Development Plan 2015-2036. Ministry of Energy.). To respond to the drastically increased electricity demand, the Ministry of Energy and Electricity Generating Authority of Thailand (EGAT) prepared the Thailand Power Development Plan 2012-2036 in order to define a power development scheme (EPPO, 2015EPPO (2019) CO2 emission in Power Generation by Energy Type. (2019). Ministry of Energy.).
Depended on the above information, Thailand still uses electricity generated from conventional sources, which has an impact on future electricity supplies. The problem is that most conventional sources have limitations and the prices of those sources increase year by year. As a result of the fluctuation in the price of conventional sources, the cost of electricity generation would go up. Besides this, the dependence on conventional sources results in the environmental impact, which is a serious problem. The emission from the power sector could result in social and environmental degradation and increasing Greenhouse Gas (GHG) emissions worldwide.
K. Pagnarith and B. Limmeechokchai studied the utilization of renewable energy and carbon dioxide mitigation in the power sector in selected Greater Mekong Subregion (GMS) countries, namely Cambodia, Thailand, Laos, and Vietnam. This study proposed several scenarios that include Renewable Energy (RE) scenario by using the LEAP model in order to estimate electricity demand and supply, CO2 emissions from the power sector and CO2 emission mitigation. The result illustrated that the electricity generation from renewable energy sources such as biomass, wind, solar photovoltaics and geothermal increased to 5.74 GW in the region, accounted for 3.5% in 2030. Thus, the RE scenario with carbon credits could decline CO2 emissions at around 36 million tons at a lower system cost when compared to the BAU scenario (Pagnarith and Limmeechokchai, 2011Pagnarith, K & Limmeechokchai, B (2011) Renewable energy utilization and CO2 mitigation in the power sector: A case study in selected GMS countries Songklanakarin J Sci Technol, 33.). T. Kusumadewi, P. Winyuchakrit and B. Limmeechokchai studied the long-term CO2 emission reduction from renewable energy in the power sector of Thailand in 2050. It included several mitigation scenarios that constructed under renewable energy and new efficient technologies by using the LEAP model (Kusumadewi et al., 2017aKusumadewi, TV, Winyuchakrit, P & Limmeechokchai, B (2017) Long-term CO2 emission reduction from renewable energy in power sector: The case of Thailand in 2050 Energy Procedia, 138, 961-6. a
[http://dx.doi.org/10.1016/j.egypro.2017.10.089] ).
I. Khan, M.W. Jak and J. Stephenson studied on the analysis of greenhouse gas emission in the electricity system using time-varying carbon intensity. This study classified that if a reduction in global GHG emissions is to be completed, the electricity sector faces two major challenges, such as ensuring that most of the new generation capacity is renewable and optimizing the relative utilization of non-renewable and renewable capacity, thus that GHG emissions are minimized. The study concluded that greenhouse gas emissions from electricity generation in New Zealand predominantly increase from generation for the base demand and intermediate demand. Peak demand was mainly met by hydro during almost all of 2015, apart from a short period of low hydro storage (Khan et al., 2018Khan, I, Jack, MW & Stephenson, J (2018) Analysis of greenhouse gas emissions in electricity systems using time-varying carbon intensity. J Clean Prod, 184, 1091-101.
[http://dx.doi.org/10.1016/j.jclepro.2018.02.309] ). However, there is a study on current and near-term GHG emissions factors from electricity production for New York State and New York City. This paper reports estimates of average GHG emissions factors for New York state and marginal GHG emissions factors for interventions in New York city. It is noticed that direct GHG emissions or those produced during the operation of the power plants can be described by average and marginal GHG emissions factors. Marginal GHG emission factors, in contrast, are meant to represent the GHG emissions that would result from a small change in electricity demand. Marginal GHG emissions factors consider the stratification of power plant dispatch, resolving that small changes in the demand will not affect the output of all power plants. Through the literature review, average and marginal GHG emissions factors have been developed with varied methodologies and data sources. The study concluded that the analysis indicates that GHG emissions factors are set to decrease, given the current projections for fuel prices and wind turbine growth rates. The results of that study make a strong case for including considerations of the future mix of electricity generators in evaluating energy efficiency and related policy decisions (Howard et al., 2017Howard, B, Waite, M & Modi, V (2017) Current and near-term GHG emissions factors from electricity production for New York State and New York City. Appl Energy, 187, 255-71.
[http://dx.doi.org/10.1016/j.apenergy.2016.11.061] ). B. Atilgan and A. Azapagic studied on life cycle environmental impacts of electricity from fossil fuels in Turkey. The paper illustrates the first time of life cycle environmental impacts of electricity generation from fossil fuel power plants in Turkey, which supply three-quarters of national demand. In addition, Turkey’s largest domestic energy source is coal, which was the main energy source until the 1970s. The large majority of coal is lignite, with the reserves 11.8 billion tones, this represents 6% of the global lignite deposits. Thus, the high share of fossil fuels in Turkey’s electricity, together with the increasing demand, has led to a steady increase in Greenhouse Gas (GHG) emissions, reaching 99 Mt CO2 eq in 2010. However, the environmental impact of energy generation in Turkey is largely unknown so that it is not possible to identify sustainable or other options for the country. The results highlight the importance of reducing the share of lignite and hard coal power in the electricity mix of Turkey which would lead to significant reductions in environmental impacts from the electricity sector, including GHG emissions. In the medium to long term, expansion of renewable electricity generation should be considered, including wind and sun energy which are abundant in Turkey. The role of carbon capture and storage, as well as nuclear power in the country’s future electricity mix, should also be investigated (Atilgan and Azapagic, 2015Birol, F (2017) Key World Energy Statistics. International Energy Agency.).
In 2018, there is a study on the status of Carbon Capture and Storage (CCS) in India’s coal-fired power plant. The majority of energy demand in India is going to be achieved by coal-based power plants. The country is heavily reliant on coal used as a primary fuel in power plant. It is noticed that India’s power sector is responsible for half of all CO2 emissions in the nation and therefore a serious attention is required in the direction to reduce GHG emission in the environment. As the level of GHG emissions is continuously increasing, therefore carbon abatement technology CCS on prove a key mitigation in this direction. In this review paper, the scope of CCS in Indian coal-fired power plant has been carried out and compared with other countries’ scenario. It concluded that the low price of carbon in the market making CCS unfavorable in globe, while high carbon prices shall be able to make it economical. High carbon prices and commissioning of the ultra-supercritical power plant along with CCS will reduce the cost almost 14-35% during 2020-2050 and CCS will face stiff competition from renewable energy in the future (Kumar et al., 2018Kumar, R, Jilte, R, Nikam, K C & Ahmadi, M H (2018) Status of carbon capture and storage in India’s coal fired power plants: A critical review. Environmental Technology & innovation, 13, 94-103.
[http://dx.doi.org/10.1016/j.eti.2018.10.013] ).
The objectives of this study are classified as the expansion of renewable energy sources, promoting efficient technologies with different carbon tax profiles in order to analyze cleaner supply-side options beyond INDC. The future electricity demand and electricity generation and the total electricity generation cost will also be recognized in this study. Moreover, the Long-range Energy Alternative Planning (LEAP) model, which has a flexible data structure, is used in order to classify electricity demand, electricity generation and emission from the power sector with differences scenarios. In addition, this study proposes new scenarios that integrate the potential of renewable energy sources in Thailand with efficient technology. Thus, the results are useful for future electricity planning. Furthermore, this study considers not only the share of electricity supply but also considers the priority of energy that produces less environmental impact.
2. THAILAND'S PARIS AGREEMENT
Being a developing country, Thailand is highly vulnerable to the impacts of climate change. Thailand attaches great importance to the global efforts to address this common and pressing challenges. In the 21st conference of parties (COP21), countries are aggreged to minimize its emissions under the Paris Agreement. Those actions can be called “Intended Nationally Determined Contributions (INDC)”. A country summited its ambitious efforts and actions in every five years after INDC. In addition, Thailand submitted its INDC and related information to the United Nations Framework Convention on Climate Change (UNFCCC) in 2015. Thailand plans to reduce its greenhouse gas emissions by 20% from the BAU level by 2030, and up to 25% if the required support is received from international organizations (INDC, 2016INDC. (2016). Thailand’s Intended Nationally Determined Contribution. NDC Rigistry.). Kusumadewi et al. studied the GHG mitigation in the power sector and analyzed renewable energy potential for Thailand’s NDC roadmap in 2030. It provided several scenarios by using the Long-range Energy Alternatives Planning (LEAP) model. The results implied that Thailand has a high potential to reduce GHG emissions by using RE and can achieve Thailand’s NDC target in 2030 (Kusumadewi et al., 2017bKusumadewi, TV, Winyuchakrit, P, Misila, P & Limmeechokchai, B (2017) GHG mitigation in power sector: Analyzes of renewable energy potential for Thailand’s NDC roadmap in 2030. Energy Procedia, 138, 69-74. b
[http://dx.doi.org/10.1016/j.egypro.2017.10.054] ). Misila et al. used the LEAP model to classify the future GHG mitigation from the energy sector in order to achieve the INDC target. Thus, the INDC plan can decrease GHG emissions by 27% in the energy sector. It was found that to achieve INDC target, one of the plans should achieve at least 75% of its target and another must achieve 50% of its target (Misila et al., 2017Misila, P, Winyuchakrit, P, Chunark, P & Limmeechokchai, B (2017) GHG mitigation potentials of Thailand’s energy policies to achieve INDC target. Energy Procedia, 138, 913-8.
[http://dx.doi.org/10.1016/j.egypro.2017.10.139] ).
3. POWER SECTOR IN THAILAND
3.1. Electricity Consumption in Thailand
Electricity consumption has increased significantly during the last decade. In 2015, the shares of electricity consumption in industrial, commercial, residential, others, agricultural and transport were 42.4%, 33.87%, 22.84%, 0.598%, 0.21% and 0.082%, respectively (EGAT, 2015EPPO. (2015). Thailand Power Development Plan 2015-2036. Ministry of Energy.). According to the Power Development Plan (PDP 2015), electricity consumption in Thailand will increase by about 2.67% per year during 2014-2036. The expected electricity consumption and peak power demand will reach around 326,120 GWh and 49,655 MW, respectively, in 2036, as estimated by the National Economic and Social Development Board (NESDB) (EPPO, 2015EPPO (2019) CO2 emission in Power Generation by Energy Type. (2019). Ministry of Energy.).
3.2. Electricity Generation in Thailand
In 2015, the total electricity generation reached 190,285 GWh, rising 3.3% from the previous year. From the energy statistics of Thailand in 2015, the shares of fuel mix from natural gas have the highest share, followed by coal/lignite, imported, renewable energy, hydropower and oil, respectively (Fig. 1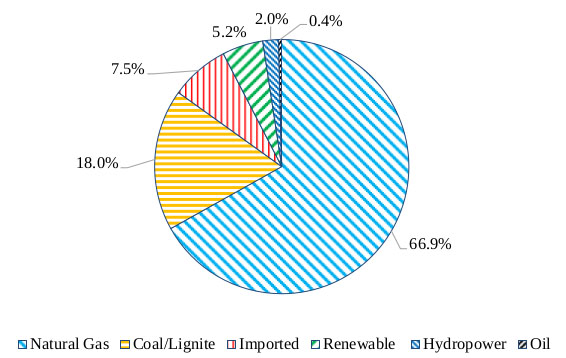 ) (EGAT, 2015EPPO. (2015). Thailand Power Development Plan 2015-2036. Ministry of Energy.).
To respond to the drastically increased electricity demand, the Ministry of Energy and Electricity Generating Authority of Thailand (EGAT) prepared the Thailand Power Development Plan 2012-2036 in order to define a power development scheme. The estimated total capacity would be approximately 70,335 MW, comprising an existing capacity of 37,612 MW, the new capacity of 57,459 MW and retired capacity during 2015-2036 of 24,736 MW (EPPO, 2015EPPO (2019) CO2 emission in Power Generation by Energy Type. (2019). Ministry of Energy.).
 |
Fig. (1) Electricity generation by fuel type in Thailand in 2015. |
3.3. Indicators of Thailand’s Power Sector
Electricity consumption is the result of human activities. The Gross Domestic Production (GDP) growth is the annual percentage growth rate of GDP at a market price based on contact local currency. In addition, the GDP growth in 2015 was 4% and it will increase to 4.2% in 2020 and decrease to 3.8% in 2030, after which it will remain constant until 2050 (EPPO, 2015EPPO (2019) CO2 emission in Power Generation by Energy Type. (2019). Ministry of Energy.). In terms of GDP per capita, Thailand was about 5,846 $/capita in 2015 (WB, 2015WB. (2015). World development indicators (WDI)https://datacatalog .worldbank.org/ dataset/world-development-indicators). Thailand’s economic and infrastructure growth prospects and the formation of the Association of Southeast Asian Nations (ASEAN) Economic Community (AEC) were seen to have effects on energy consumption in this country. Therefore, the Ministry of Energy constructed energy master plans in 2015, which resulted in the reduction of energy consumption and GHG emissions. They are Alternative Energy Development Plan 2015-2036 (AEDP 2015), Energy Efficiency Plan 2015-2036 (EEP2015), and Thailand Power Development Plan 2015-2036 (PDP2015). Thus, these plans focus on energy security, economy and ecology issues (EPPO, 2015EPPO (2019) CO2 emission in Power Generation by Energy Type. (2019). Ministry of Energy.).
3.4. Carbon Dioxide Emissions
Carbon dioxide emissions from the power sector could be classified by relying on the basis of reference and sectoral approaches, which are provided by the Intergovernmental Panel on Climate Change (IPCC). It is noticed that CO2 emissions, therefore, are the most important cause of global warming. CO2 emission will increase due to human behaviors, global energy use, economic improvement, and population growth. In addition, the major sources of CO2 emissions were from fuel combustion, such as coal bituminous and oil. In addition, CO2 emission from natural gas, coal/lignite and oil accounted for 57,989.32 kilotons (kt), 32,050.72 kt and 843.4 kt and increased to 67,755.5 kt, 36,107.92 kt, and 1,046.59 kt respectively in 2015 (EPPO, 2019Ener. AB, Devel, Y. (2015). Renewable Energy Developments and Potential in the Greater Mekong Subregion. The Phillippines.). In terms of CO2 emission per capita, Thailand accounted for 3.64 tCO2/capita in 2015 which is higher than neighboring countries (Birol, 2017EGAT. (2015). Annual Report. Electrcity Generating Authority of Thailand.). Thus, CO2 emissions from the power sector can be decreased by the substitution of conventional power plans with renewable energy-based electricity generation with efficient technologies.
In 2012, K. Promjiraprawat and B. Limmeechokchai determined Thailand’s energy policies and CO2 emission on renewable electricity generation and energy efficiency. In the study, a Power Generation Expansion Plans (PGEPs) model and mathematical formulation of Mix Integration Linear Programming (MILP) model were used with four different scenarios, such as business-as-usual, renewable energy, energy efficiency, and renewable energy with energy efficiency. It is noticed that all scenarios are considered in order to achieve 20% and 40% of CO2 reduction targets. Results illustrated that coal-fired generating technologies were the main contributors to electricity generation in the BAU scenario. In addition, the expansion of nuclear power usage and natural gas resources would achieve the 40% CO2 reduction target. The CO2 emission reduction surely contributes to the satisfaction of government expected emissions of 0.44 kgCO2/kWh without relying on the power imported (Promjiraprawat and Limmeechokchai, 2012Promjiraprawat, K & Limmeechokchai, B (2012) Assessment of Thailand’s energy policies and CO2 emissions: Analyses of energy efficiency measures and renewable power generation Energies, 5, 3074-93.
[http://dx.doi.org/10.3390/en5083074] ).
4. METHODOLOGY
Electricity planning analysis scenarios are generally constructed using available data and assumptions within the appropriate generation system to predict future conditions. The data required in this study mostly take from the Ministry of Energy, government report, review paper, and online databases. Moreover, the estimation of future electricity demand in this study based on the Gross Domestic Product (GDP) and GDP elasticity of electricity demand. Fig. (2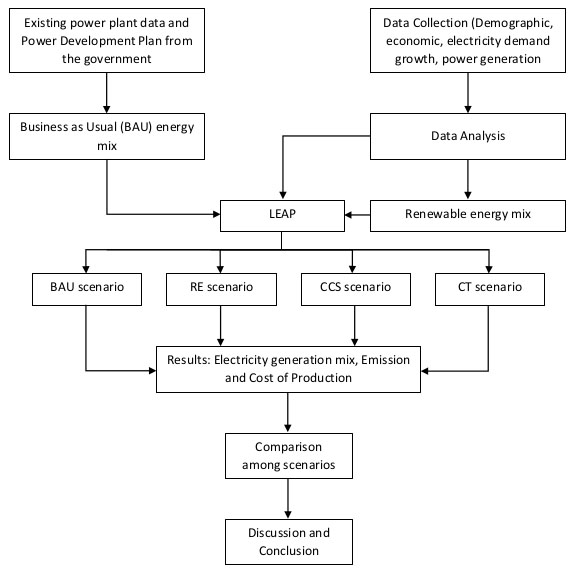 ) illustrates the methodology of this study.
 |
Fig. (2) Flow chart of methodology. |
4.1. LEAP Model
LEAP (Long-range Energy Alternative Planning) is a simulation tool that can be used to analyze climate change mitigation. LEAP was developed by the Stockholm Environmental Institute (Stockholm Environment Institute, 2017Stockholm Environment Institute. (2017). Long-range energy alternative planning system; User guide for LEAP .https://www.energycommunity.org/ default.asp?action=download). The LEAP model has a flexible data structure, which is not only easy to use but also rich in technical and end-user details (Heaps and Kollmuss, 2008Heaps, C & Kollmuss, A (2008) Unfccc resource guide for preparing the national communications of non-annex i parties. Module 4: Measures to Mitigate Climate Change).
LEAP provides a suitable result of the energy demand upon policies of the government and the typical household users with dissimilar class by the level of income and financial outlook in urban and rural areas under the scheme to develop the quality of people’s occupation and to cut down the wood reliance (Heaps and Kollmuss, 2008Heaps, C & Kollmuss, A (2008) Unfccc resource guide for preparing the national communications of non-annex i parties. Module 4: Measures to Mitigate Climate Change). The LEAP model allows policymakers to create an energy forecasted system based on existing energy demand and generation data. Moreover, users can make the comparison on the result from different scenarios. Furthermore, LEAP can be used to define medium or long-term energy and environmental planning. It can be beneficial to estimate medium and long-term energy demand and supply in countries regarding the different driving factors, and also determine the cost of electricity generation, greenhouse gas emissions, distribution and end-use activities (Tao et al., 2011Tao, Z, Zhao, L & Changxin, Z (2011) Research on the prospects of low-carbon economic development in China based on LEAP model. Energy Procedia, 5, 695-9.
[http://dx.doi.org/10.1016/j.egypro.2011.03.123] ). Moreover, LEAP provides not only an area of accounting simulation but also provides an escalation methodology which is effective for modeling electric and energy production. This modeling is appropriately flexible and clear, and it is not hard to combine data and results from other models. Furthermore, the model includes a Technological and Environmental Database (TED) that can be used to determine energy consumption and potential emissions (Shan et al., 2012Shan, B-g, Xu, M-j, Zhu, F-g & Zhang, C-l (2012) China’s energy demand scenario analysis in 2030. Energy Procedia, 14, 1292-8.
[http://dx.doi.org/10.1016/j.egypro.2011.12.1091] ).
4.2. Description of Scenarios
In this study, there are four main scenarios, namely Business As Usual (BAU) Renewable Energy (RE), Carbon Capture Storage (CCS), and Carbon Tax (CT) scenarios have been considered. In the BAU scenario, power development data were collected from Power Development Plans of Thailand and the electricity demand forecast relied on population growth, GDP growth rate, history of electricity demand and electrification, transmission and distribution loss and type of power plants. In addition, three scenarios under RE namely RE1, RE2, and RE3 scenarios have been constructed by promoting renewable energy sources such as biomass and solar. Moreover, in the CCS scenario, the utilization of CCS technology will apply to 25% of coal-fired power plants and 25% of natural gas plants from 2020 to 2050. In the CTs scenarios, Thailand will develop two carbon tax profiles, which are carbon taxes of $100/tCO2 from 2020 to 2050 and $20/tCO2 from 2020, which will increase to $500/tCO2 by 2050.
4.2.1. Business as Usual (BAU) Scenario
In the BAU scenario, future electricity demand is forecasted by relying on population growth, GDP growth, and historical data. The planning period in this study is from 2015 to 2050. In addition, the share of electricity generation is based on the Power Development Plan (PDP) of Thailand and the report of relevant authorities. The future electricity demand is forecasted by the following criteria:
- Population Growth: Depending on the World Development Indicators (WDI) report, the population growth in Thailand would annually be 0.25% (WB, 2015WB. (2015). World development indicators (WDI)https://datacatalog .worldbank.org/ dataset/world-development-indicators).
- GDP Growth: The annual percentage growth rate of GDP at a market price based on constant local currency. In Thailand, GDP growth in 2015 was 4% and it will increase to 4.2% in 2020 before decreasing to 3.8% in 2030, after which it will remain constant until 2050.
- Electricity Demand: It is forecasted by depending on Gross Domestic Product (GDP) and GDP elasticity of electricity demand. The GDP elasticity is estimated based on the regression analysis using a linear equation with the GDP as the independent variable and electricity demand as the dependent variable. Fig. (3
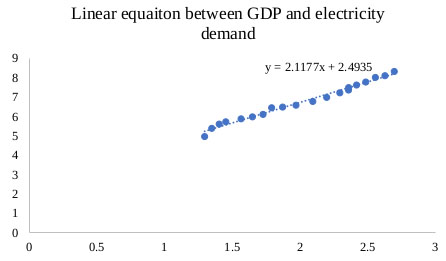 ) illustrates the linear equation between GDP and electricity demand. It is noticed that the coefficient of the equation is the GDP elasticity.
- Population Access to Electricity: Access to electricity is the percentage of the population with access to electricity. The data of electrification are collected from industry, national surveys, and international sources. In Thailand, the population has very high access to the electricity grid with almost 99% in 2015 and it will be nearly 100% in 2050.
- Type of Power Plant: There are different types of power plants used in order to generate electricity. The capital cost, fixed O&M cost, variable O&M cost, process efficiency, capacity credit, lifetime and merit order of power plants are really important.
 |
Fig. (3) Linear equation between GDP and electricity demand. |
4.2.2. Renewable Energy (RE) Scenarios
The main objective of the Renewable Energy (RE) scenario is to integrate the use of domestic renewable energy resources in Thailand. RE1 scenario considers a 5% increase of electricity generation from solar, and the RE2 scenario considers a 5% increase of biomass power generation by 2050. The RE3 scenario considers a 10% increase in electricity generation from solar and biomass by 2050. With these percentages, Thailand would generate the maximum potential capacity of renewable energy sources by 2050. In case we propose more than 5%, electricity generation generate from these sources will be higher than the potential capacity.
4.2.3. Carbon Capture Storage (CCS) Scenario
The increase in coal-fired and natural gas power plants contributes significantly to total carbon dioxide emissions. New efficient CO2 Capture and Storage (CCS) is used in order to replace coal-fired and natural gas power plants.
In the CCS scenario, the utilization of CCS technology will apply to 25% of coal-fired power plants and 25% of natural gas plants from 2020 to 2050. Thus, carbon dioxide emissions from coal-fired and natural gas power plants are expected to reduce in the CCS scenario.
4.2.4. Carbon Tax (CT) Scenario
Two carbon tax rates, CT100 and CT500 are considered in this study. The CT100 scenario uses a constant rate of $100/tCO2 from 2020 to 2050. In addition, a carbon tax of $20/tCO2 from 2020 which will increase to $500/tCO2 by 2050 has been imposed in the CT500 scenario. The effects are assessed of two different levels of carbon tax (CT500 and CT100) on total primary energy supply, sectoral energy mix, and carbon dioxide emissions. Fig. (4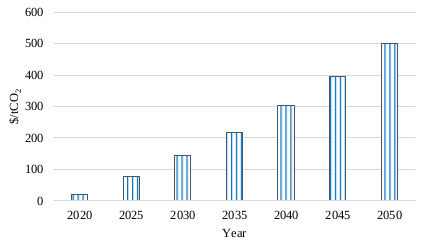 ) provides the variation in carbon price during 2020-2050 under the CT500 scenario.
 |
Fig. (4) Variation in carbon price from 2020 to 2050 under CT500 scenario. |
5. RESULTS AND DISCUSSION
Results in this section are presented of the electricity demand and supply, the carbon dioxide emission from the power sector, and the electricity generation cost in the BAU, RE, CCS and CT scenarios. It is noticed that this study allows policymakers to consider future electricity generation in Thailand. Moreover, this study proposes new scenarios that integrate the potential of renewable energy sources in Thailand with efficient technologies. Thus, the results are useful for future electricity planning. In addition, this study considers not only the share of electricity supply but also considers the priority of energy that produces less environmental impact. Among all theses scenario, the CT500 scenario would result in the highest CO2 reduction from the power sector in Thailand. It is noticed that among RE scenarios, RE3 scenario has the highest CO2 emission reduction. Thailand would achieve the maximum renewable energy in the electricity generation mix. Results highlighted that either carbon tax or carbon capture and storage scenario has high potential CO2 emission mitigation, but at a high cost of production in Thailand.
5.1. Electricity Demand
5.1.1. BAU, RE, CCS and CT Scenarios
In this study, it is assumed that the total electricity demand in the BAU, RE, CCS and CT scenario is the same during the planning period. During the time span, total electricity demand in 2050 will rise upto 2.33 times when compared with the base year. In the BAU scenario, the total electricity demand was around 185,572 GWh and it will increase to 432,728 GWh in 2050. The share of electricity demand in the industrial, commercial, residential, others, agriculture, and transportation sectors will be 42.1%, 34.2%, 22.8%, 0.6%, 0.2%, and 0.1%, respectively in 2050. Thailand is an upper-middle-income country, and the electricity consumption per capita in Thailand was 2,621.07 kWh/capita in 2015 and is expected to reach 6,619.67 kWh/capita in 2050. Fig. (5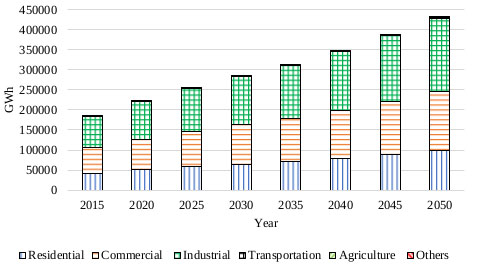 ) provides the electricity demand by each sector during the planning period.
 |
Fig. (5) Electricity demand by each sector. |
5.2. Electricity Generation
5.2.1. BAU Scenario
There are many types of electricity generation sources such as natural gas, imported electricity, coal bituminous, biomass, solar, hydropower, coal lignite, wind, nuclear, biogas, MSW, fuel oil, and diesel, which have been used in Thailand. Total electricity generation in 2015 was about 192,655 GWh and it will increase to around 455,503.2 GWh by 2050. Shares of natural gas become the main electricity generation sources during 2015-2050. Thus, the percentage of electricity generation from natural gas, imported electricity, coal bituminous, biomass, solar, hydropower, coal lignite, wind, nuclear, biogas, MSW, and fuel oil will be 41.4%, 12%, 11.1%, 10.3%, 9.7%, 6.1%, 4%, 2%, 1.9%, 1.1%, 0.6%, and 0.01%, respectively in 2050. Fig. (6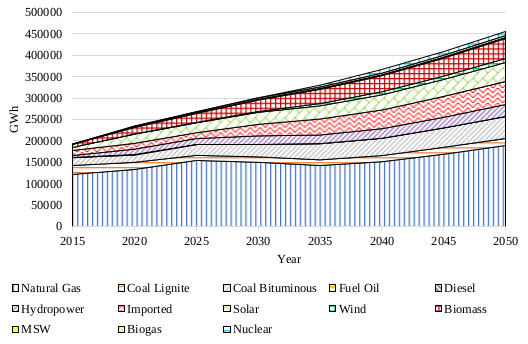 ) illustrates the electricity generation by fuel type in the BAU scenario.
 |
Fig. (6) Electricity generation by fuel type in the BAU scenario. |
5.2.2. RE Scenarios
Results in the RE scenarios are divided into three parts, which are the electricity generation in the RE1, RE2, and RE3 scenarios. With the promotion of solar PV in the power sector from 2020 in the RE1 scenario, the share of electricity generation from solar will increase from 4% in 2020 to 15% by 2050. In 2050, the electricity generation from solar will increase by 23,939.4 GWh (5%) when compared with the base case. The percentage of electricity generation from natural gas, solar, import, biomass, coal bituminous, hydropower, coal lignite, wind, nuclear, biogas, and MSW will be 38%, 14.9%, 13.5%, 10.1%, 8.2%, 6%, 3.9%, 1.9%, 1.8%, 1.1%, and 0.6% in 2050, respectively. Fig. (7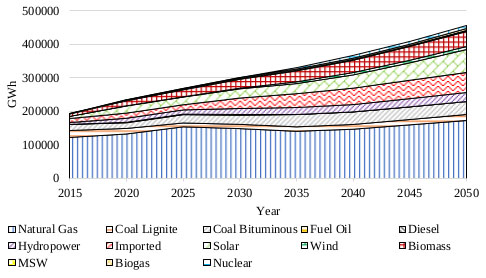 ) provides the electricity generation by fuel type in the RE1 scenario.
In the RE2 scenario, with the promoting of biomass usage in the power generation, the electricity generation share of biomass will increase from 6.5% in 2020 to 15.6% after 30 years. When compared with the base case, in 2050, the share of electricity generation from biomass in the RE2 scenario is expected to increase around 5.3%.
In the RE3 scenario, which integrates renewable energy sources such as solar and biomass in power generation, the percentage of solar and biomass will increase from 16% in 2020 to 30% by 2050. In 2050, electricity generation from natural gas and coal bituminous will significantly decrease 27,862.6 GWh (6.1%) and 25,531 GWh (5.6%), respectively, when compared with the base case. The electricity generation by fuel type in the RE3 scenario is presented in Fig. (8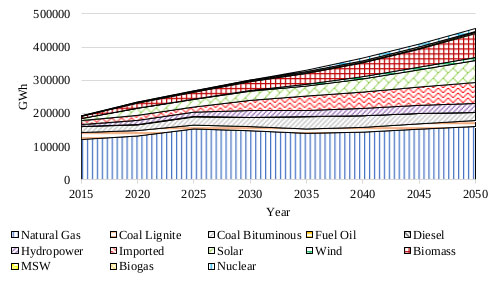 ).
).
 |
Fig. (7) Electricity generation by fuel type in the RE1 scenario. |
 |
Fig. (8) Electricity generation by fuel type in the RE3 scenario. |
5.2.3. CCS Scenario
In the CCS scenario, the electricity generation share will be the same as in the BAU scenario. CCS technologies will affect the CO2 emission from the power sector in this scenario. In addition, the electricity generation from coal bituminous and natural gas would increase by 64% and 35%, respectively, during 2015-2050.
5.2.4. CT Scenario
Regarding the two carbon tax rates in this scenario, the results will be divided into two parts, which are the total electricity generation in the CT100 and in the CT500 scenarios. With the introduction of the carbon tax, the total electricity generation will not change, while the share of electricity generation sources will differ significantly when compared with other scenarios.
In the CT100 scenario, the share of electricity generation from natural gas and coal lignite will significantly decrease from 25.8% in 2020 to 15.6% in 2050 for natural gas, and from 12.9% in 2020 to 5.4% in 2050 for coal lignite. However, the shares of imported electricity and coal bituminous will slightly increase by 6.3% and 3.2%, respectively, during the planning period. Fig. (9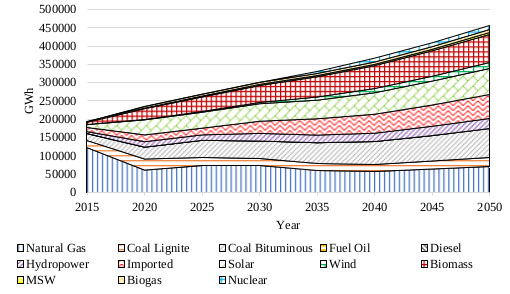 ) describes the share of electricity generation in the CT100 scenario.
In the CT500 scenario, natural gas will have the highest share of electricity generation, while coal lignite, coal bituminous, fuel oil, and diesel are expected to reduce in 2050. Shares of electricity generation from natural gas, imported, biomass, solar, hydropower, coal bituminous, wind, nuclear, biogas, MSW, and coal lignite will be 35.21%, 17.1%, 17.06%, 16.07%, 6.21%, 4.21%, 3.25%, 2.31%, 1.8%, 0.98%, and 0.35%, respectively, in 2050.
 |
Fig. (9) Electricity generation by fuel type in CT100 scenario. |
5.3. CO2 Emissions
5.3.1. BAU Scenario
The aim of this study is to propose renewable energy sources and efficient technologies in order to minimize CO2 emissions from the power sector beyond the NDC target. In the BAU scenario, the CO2 emission from the power sector in 2015 was accounted for 115.5 million ton of CO2 equivalent (MtCO2e) and it is expected to reach 184.2 MtCO2e by 2050. Fig. (10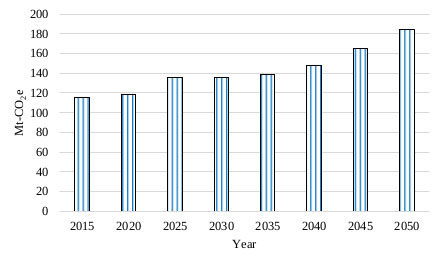 ) illustrates the total CO2 emission from the power sector during the 2015-2050.
 |
Fig. (10) CO2 emission from the power sector in the BAU scenario. |
5.3.2. RE Scenarios
By promoting solar and biomass electricity generation, the carbon dioxide emission in the RE3, RE2, and RE1 scenario will reduce after 2020. In 2050, carbon dioxide emissions reduction from the RE3, RE1, and RE2 scenarios will be accounted for 40.21 MtCO2e, 21.66 MtCO2e, and 21.11 MtCO2e, respectively as compared with the BAU scenario. It is noticed that CO2 emissions reduction in RE scenarios will significantly reduce after 2035. Fig. (11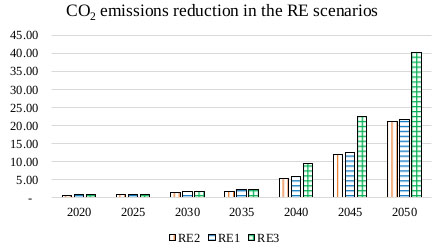 ) describes the carbon dioxide emissions reduction in the RE scenarios.
 |
Fig. (11) CO2 emissions reduction in the RE scenarios. |
5.3.3. CCS Scenario
The promotion of new efficient CO2 Capture and Storage (CCS), is used in order to substitute coal-fired and natural gas power plants. Thus, the carbon dioxide emission in the CCS scenario is expected to be mitigated by 28.49 MtCO2e in 2020 and 44.22 MtCO2e in 2050 when compared with the BAU scenario. This is because the CCS technologies are included in natural gas and coal power generation during 2020-2050. Fig. (12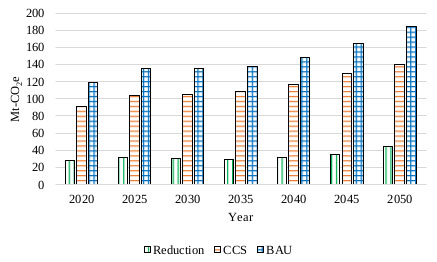 ) provides the carbon dioxide emissions reduction in the CCS scenario by compared with the BAU scenario.
 |
Fig. (12) CO2 emissions reduction in the CCS scenario. |
5.3.4. CT Scenarios
Among the carbon tax scenarios, the CT500 scenario will be the highest carbon dioxide emission reduction (73.37 MtCO2e), followed by the CT100 scenario (50.3 MtCO2e) in 2050. The promotion of carbon tax results in carbon dioxide emission reduction in the power sector by shifting from high carbon fuels to renewable energy sources and imported electricity. Fig. (13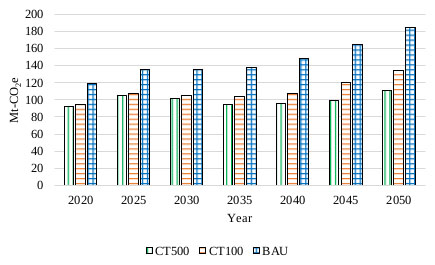 ) illustrates the carbon dioxide emission from the carbon tax scenario and compares it with the BAU scenario.
 |
Fig. (13) CO2 emission in the CT scenarios. |
5.4. CO2 Emission Per Capita
CO2 emission per capita, which is estimated relying on a number of population and total CO2 emission, was also investigated in this study. The CO2 emission per capita in the BAU scenario would increase from 1.68 metric tons/capita (t/capita) to 2.82 t/capita during 2015-2050. The CT500 scenario has the lowest CO2 emission per capita (1.7 t/capita) in 2050, followed by the CT100 scenario (2.05 t/capita), RE3 (2.2 t/capita), CCS (2.22 t/capita), RE1 (2.49 t/capita), and RE2 (2.5 t/capita), respectively. Fig. (14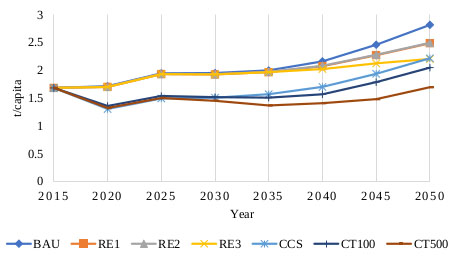 ) shows CO2 emission per capita in each scenario.
 |
Fig. (14) CO2 emission per capita in each scenario. |
5.5. The Cost of Electricity Generation
Fig. (15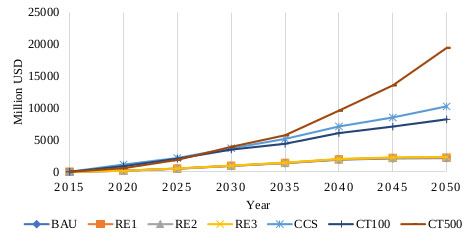 ) provides the cost of electricity generation in each scenario, which is calculated by the LEAP model during the planning period.
 |
Fig. (15) Cost of electricity generation in each scenario in Thailand. |
The total cost of electricity generation in the BAU scenario significantly increases by almost 6 times during 2015-2050. In 2050, the CT500 scenario has the highest cost of electricity generation and it will increase around 14 times when compared with the BAU scenario. This is because of the promoting of carbon tax into the power sector in Thailand, which will result in reducing high carbon fuels and replacing them with more expensive sources such as natural gas and renewable energy. In addition, the cost of electricity generation in the CT100, CCS, RE3, EV, RE2, and RE1 scenarios will be 34,236.9 million USD, 25,343.6 million USD, 6,609.9 million USD, 6,469.2 million USD, 6,306.7 million USD, and 6,027.7 million USD, respectively, in 2050.
5.6. Comparison between CO2 Mitigation Scenarios and INDC’s Target
Fig. (16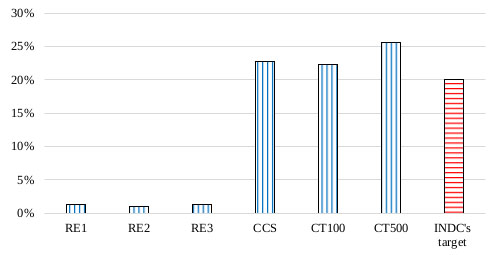 ) illustrates the comparison between the percentage of carbon dioxide emission reduction by each scenario and the CO2 emission reduction in INDC’s target by 2030.
 |
Fig. (16) The percentage of CO2 mitigation by each scenario and INDC’s target. |
Regarding Fig. (16), the share of carbon dioxide emission reduction in the RE1, RE2, and RE3 scenarios will be 1.3%, 1.02%, and 1.3% in 2030, respectively. Thus, the renewable energy scenarios alone will not achieve the INDC’s target which is accounted for 20%. In addition, the share of CO2 emission reduction in the CCS, CT100, and CT500 scenario is expected to be 22.8%, 22.3% and 25.6% in 2030, respectively. With these reductions, the CCS, CT500, and CT100 scenarios will achieve higher than the INDC’s target by 2030. The less contribution of RE in CO2 emission reduction before 2030 is due to lifetimes of the existing fossil-based power generation technologies.
CONCLUSION
This study considered the possibility of CO2 emission mitigation under renewable energy, efficient technology, and carbon tax scenario from the power sector of Thailand in order to provide clean energy supply beyond INDC’s target. Results show that the total electricity generation in Thailand is expected to increase from 192,655 GWh to 455,503.2 GWh by 2050. Moreover, CO2 emissions from power generation in the CT500 scenario would be 327.39 MtCO2e during 2020-2050. In addition, the CT100 scenario has the second-largest CO2 emission reduction (253.33 MtCO2e), followed by the CCS scenario (231.43 MtCO2e), RE3 scenario (78.13 MtCO2e), RE1 scenario (46.23 MtCO2e), RE2 scenario (43.45 MtCO2e), and RE3 scenario (43.45 Mt CO2e) during 2020-2050. In the matter of electricity generation cost, the CT500 scenario with the high CO2 reduction is expected to have the highest total cost of electricity generation at 297.58 trillion USD during the planning period. Total cost of electricity generation from the power sector in Thailand is expected to be 185.45 trillion USD, 147.19 trillion USD, 31.63 trillion USD, 31.03 trillion USD, 30.53 trillion USD, 30.04 trillion USD and 29.8 trillion USD in the CT100, CCS, RE3, RE2, RE1, and BAU scenarios, respectively, during the planning period. Results highlighted that either carbon tax or carbon capture and storage scenario has a high potential for CO2 emission mitigation, but at a higher electricity generation cost in Thailand. The cleaner and renewable energy technologies can contribute to large CO2 emission reduction if they are planned in the early stages. It is found that CCS, CT500, and CT100 scenarios will achieve higher than Thailand’s INDC target by 2030. In conclusion, renewable energy, efficient technologies, and carbon tax offer many advantages in terms of CO2 emission reduction from the environment.
CONSENT FOR PUBLICATION
Not applicable.
AVAILABILITY OF DATA AND MATERIALS
Not applicable.
FUNDING
None.
CONFLICT OF INTEREST
The authors declare no conflict of interest, financial or otherwise.
ACKNOWLEDGEMENTS
Declared none.