- Home
- About Journals
-
Information for Authors/ReviewersEditorial Policies
Publication Fee
Publication Cycle - Process Flowchart
Online Manuscript Submission and Tracking System
Publishing Ethics and Rectitude
Authorship
Author Benefits
Reviewer Guidelines
Guest Editor Guidelines
Peer Review Workflow
Quick Track Option
Copyediting Services
Bentham Open Membership
Bentham Open Advisory Board
Archiving Policies
Fabricating and Stating False Information
Post Publication Discussions and Corrections
Editorial Management
Advertise With Us
Funding Agencies
Rate List
Kudos
General FAQs
Special Fee Waivers and Discounts
- Contact
- Help
- About Us
- Search


The Open Electrical & Electronic Engineering Journal
(Discontinued)
ISSN: 1874-1290 ― Volume 13, 2019
Comparison of Neural Networks and Logistic Regression in Assessing the Occurrence of Failures in Steel Structures of Transmission Lines
A.C.G Bissacot1, *, S.A.B Salgado2, P.P Balestrassi1, *, A.P Paiva1, A.C Zambroni Souza2, R. Wazen3
Abstract
In this work, we evaluate the probability of falling metal structures from transmission lines. It is our objective to extract knowledge about which variables influence the mechanical behavior of the operating lines and can be used to diagnose potential falling towers. Those pieces of information can become a basis for directing the investments of reinforcement structures, avoiding the occurrence of long turn offs and high costs as a consequence of damage to towers of transmission lines. The results are obtained using the history of 181 metal structures currently in operation in the state of Paraná/Brazil. For the classification of transmission lines susceptible to failures it is proposed to identify the most likely lines considering the following parameters: operating voltage, wind and relief of the region, air masses, temperature, land type, mechanical capacity, function and foundation structure. The classic technique of classifying binary events used in this type of problem is the logistic regression (LR). The more recent technique for classification, using Artificial Neural Networks (ANN) can also be applied. The results are compared through the area under receiver operating characteristics (ROC) curves.
Article Information

Identifiers and Pagination:
Year: 2016Volume: 10
First Page: 11
Last Page: 26
Publisher Id: TOEEJ-10-11
DOI: 10.2174/1874129001610010011
Article History:
Received Date: 28/3/2015Revision Received Date: 17/6/2015
Acceptance Date: 8/8/2015
Electronic publication date: 17/3/2016
Collection year: 2016
open-access license: This is an open access article licensed under the terms of the Creative Commons Attribution-Non-Commercial 4.0 International Public License (CC BY-NC 4.0) (https://creativecommons.org/licenses/by-nc/4.0/legalcode), which permits unrestricted, non-commercial use, distribution and reproduction in any medium, provided the work is properly cited.
* Address correspondence to these authors at the Institute of Industrial Engineering - Federal University of Itajuba, Brazil; Tel: +55 35 88776958; E-mail: ppbalestrassi@gmail.com
| Open Peer Review Details | |||
|---|---|---|---|
| Manuscript submitted on 28-3-2015 |
Original Manuscript | Comparison of Neural Networks and Logistic Regression in Assessing the Occurrence of Failures in Steel Structures of Transmission Lines | |
1. INTRODUCTION
Aerial transmission lines are exposed to various risks associated with the environment, to changes in building characteristics and climatic variations. Often, these risks can lead to serious damage, incurring structure falls. The fall of a structure can interrupt the power supply of a location for a long period as well as generate costs in the reconstruction of tracks of the electrical system, the profit loss for the concessionaire and costs in compensations related to damages originated from lack of energy. Due to the importance of aerial lines, a quantitative analysis of their characteristics in order to identify and mitigate them has much to contribute to the planning, operation and maintenance of lines.
It is intended here to extract knowledge about the parameters and variables that influence the mechanical behavior of the operating lines and can be used to diagnose potential falling towers. This information can become a basis for directing the investments of reinforcement structures, avoiding the occurrence of long turn off and high costs as a consequence of damage to towers of transmission lines. Few studies of classification of failures in transmission lines are found in the literature and generally explore constructive aspects of lines, reliability and construction. Wazen et al. [1R.N. Wazen, T.S. Fernandes, A.R. Aoki, and W.E. de Souza, "Evaluation of the susceptibility of failures in steel structures of transmission lines", J. Control Autom. Electr. Syst., vol. 24, no. 1-2, pp. 174-186, 2013.
[http://dx.doi.org/10.1007/s40313-013-0019-0] ] evaluated the susceptibility of metal structures of a transmission line using logistic regression and approximate joint failures. This paper’s findings were obtained by exploring a real case from historical data of 181 metal structures currently in operation in the state of Paraná/Brazil. The dataset analyzed presents ten explanatory variables (voltage, wind, relief, cold air masses, hot air masses, temperature, land, capacity, function, foundation) and a binary response variable of type that considers the fall (or not) of the metal structure. Classification models using LR and ANN methodologies were applied to the data and compared through the area under the receiver operating characteristic curve (AUC).
The paper is organized as follows. Section 1 introduced the context of the analyzed problem. Section 2 presents a review of papers reporting the use and comparison of artificial neural networks and logistic regression in different domains. Section 3 presents the case under study highlighting the main aspects of transmission lines and the relevant variables in determining structural failure. Section 4 shows the classic technique of binary logistic regression and classification results for the historical dataset. Section 5 presents the classification methodology and results based on the use of ANNs. A comparative analysis between the proposed ANN and classical LR methods is also performed through the area under the ROC curves. The main results and conclusions are discussed in section 6.
2. REVIEW OF ANN AND LOGISTIC REGRESSION FOR CLASSIFICATION PROBLEMS
Classification is one of the most frequently encountered decision making tasks of human activity. A classification problem occurs when an object needs to be assigned into a predefined group or class based on a number of observed attributes related to that object. Traditionally, statistical classification procedures deal with these kind of problems but one major limitation is that they work well only when the underlying assumptions of the model are satisfied. Thus, due to characteristics aforementioned, ANNs have emerged as an important alternative tool for classification [2G.P. Zhang, "Neural networks for classification: a survey", IEEE Trans. Syst. Man Cybern C Appl Rev., vol. 30, no. 4, pp. 451-462, 2000.].
Over the years, there have been an increasing number of papers exploring the use of ANNs as a promising alternative methodology in comparison to the most consecrated methodology of LR. The characteristics of each of the reviewed works are presented in Table 1. The first column demonstrates what work is being analyzed. The second shows the nature of the papers, that is, if the authors prioritized a conceptual, a review or an application approach. The third presents their objectives and the fourth exposes which of the two methodologies has had a better performance.
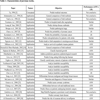
Fig. (1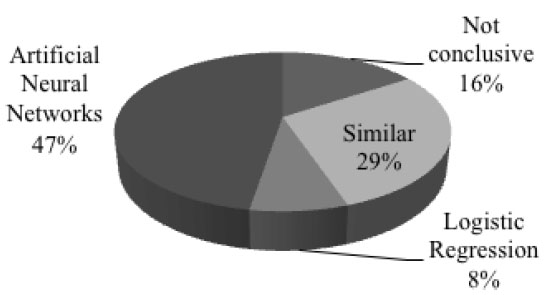 ) summarizes the characteristics observed, reporting the percentage of works in which ANNs outperformed LR and vice versa. Not conclusive or similar performances are also presented.
 |
Fig. (1) Percentage of works in which each methodology was better than the other. |
3. TRANSMISSION LINES
Transmission lines are circuits that interconnect substations, power plants or energy distributors. These circuits are composed of self-supporting towers or poles, as well as the flow of metal for power wires. Its main function is to transport large volumes of electricity with the least possible loss of energy. Transmission systems can happen in alternating or direct cables. Among the systems, the most used in Brazil is alternating and its application occurs in three-phase circuit chains with just one high voltage transmission line in direct current. These are compositions for interconnection of energy in the country, with different consumer centers as well as to supply large industrial facilities. Brazilian system transmits voltage of 69 kV, 88 kV, 138 kV, 230 kV, 345 kV, 525 kV and 750 kV.
According to Wazen et al. [1R.N. Wazen, T.S. Fernandes, A.R. Aoki, and W.E. de Souza, "Evaluation of the susceptibility of failures in steel structures of transmission lines", J. Control Autom. Electr. Syst., vol. 24, no. 1-2, pp. 174-186, 2013.
[http://dx.doi.org/10.1007/s40313-013-0019-0] ], in order to conveniently analyze the reasons for the discontinuation of energy transmission due to contingencies in transmission lines caused by external factors, it is necessary to describe the types and configurations of structures, cables and foundations.
- Structures: The dimensions and shapes of the structures depend on the required disposition of the conductors, the distance between them, the size and kind of isolation, arrows projected for the conductors, minimum safety height and the number of circuits involved. The design of a transmission line structure depends on both the charge to be transported (directly linked to the capacity and performance of the wire) as well as the size of the structure to be used. These values are calculated considering the security and performance compared to the values of voltage and efforts that structures will be submitted. Structures can be classified on some criteria, described on Table 2.

The types and configurations of structures in use are varied. The framework projects are not limited to the models already applied. But to define a new model, a large amount of information is required to find an efficient configuration and is not applied exclusively to a structure of a series of projected lines. The application of appropriate materials as well as voltage levels eventually turns even more difficult to define standardized structures.
- Cables: The cables can be differentiated according to the various functions that a transmission line can have, which can be power conductors, protectors against outbreaks atmospheric and overcurrent, or even energy dissipation. The conductor cable can be called as an active part of a transmission line because it serves as a guide to the electric and magnetic fields. In power cables, the great majority is made of aluminium having core galvanized steel (steel core).
- Foundations: The foundations are designed to balance the action of the forces acting on the top of the structure and its equipment, and it must take into account the type of soil where it will be located. With this, it is necessary to perform a reconciliation of these factors so that foundations can be better implemented without generating excess material or settling the forces to which it will be exposed.
- Concrete Foundations: Some concessionaries use concrete in some of its foundations, and its use depends on the preparation of concrete. For this preparation the concrete should be mixed mechanically according to the amounts stipulated by the structure design. The amount of concrete prepared in each operation is strictly necessary for immediate use. Fresh concrete should suffer the least possible distance of transportation and be released immediately after mixing and kneading. In cases of use of waterproofing for concreting with the presence of water, this time interval for release should be extremely short, so that the mass is practically uniform. Considering these basic situations for applying concrete, follow the types of foundation applied to transmission lines. Among the types of foundation, we highlight the caisson foundation, which is a kind of deeper foundation, excavated with shovel, pick, or auger. Once you put the armor for concrete, concreting is performed. Generally, you use shackles of reinforced concrete, to make the bracing of the trunk (top layer of concrete) and the reinforced concrete shoe, which is a shorter concrete foundation in relation to the dimensions of the base. They are typically a square base and inclined or vertical shaft.
- Metallic Foundation: Metallic foundations are used in regions where the ground has good cohesion. The foundations that implemented purely metallic structures of transmission lines have pyramidal shape, so that the connection to the structure is made from the top of the pyramid and all of its internal area is hollow and filled with soil. This format turns the soil itself in a mechanical barrier that prevents the base of the foundation (base of pyramid) to rise or move laterally. Variations on this type of foundation occur as the size height, dimensions of the stringers and sheet metal to be applied. As an example of variations, there is the metal grid, which is classified as a shallow foundation, connected to the foot (amount) of the tower at ground level. The foundation base (grid itself) consists of platters (U profile) and angles. They are shallow foundations with 2-4 feet deep, recommended for clay, sandy soil, but dry and with increasing strength with depth and with the possibility of being excavated in the open air.
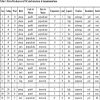
Now that the structures, cables and foundations were described, it is important to stress that every type of equipment can suffer great efforts. A functional failure, which can even be a fall of structures, could happen. Fallen towers represent a critical issue and their causes must be examined. Table 3 presents part of the data set which comprehends 181 metal structures of transmission lines currently in operation in the state of Paraná/Brazil.
The attributes selected for this article were: operating voltage, wind and relief of the region, air masses, temperatures in the region, land type, mechanical capacity of the structure, function and type of foundation structure.
The response of interest is dichotomous, i.e. if there was a structure falling or not. Among all selected explanatory variables or attributes in the data set, only three variables are quantitative and the others are qualitative. Quantitative variables vary within a certain range, according to its characteristic, and qualitative variables have different classifications according to their nature. Explanatory variables are described below.
- Operating Voltage: The electrical system of the state of Paraná has transmission lines in the following voltages: {69, 138, 230, 525} where each value is given in kV.
- Wind of the Region: Wind is an important feature that increases the susceptibility of occurrence of falling structure. It varies according to the region where the structure is located. The wind attribute has the following ranges {16, 17, 18, 19, 20, 21, 22, 23, 24, 25, 26} where each value is measured in km/h.
- Relief: The land in which the structures are set shows formations that help in the visualization of the points where the structure has a greater chance of falling. This attribute is ranked {plain, plateau, ridge, valley}.
- Air Masses: As air masses are different they have different senses of displacement, interference is studied independently. Each of the masses generates lateral forces to the cables may be of greater or lesser impact, causing a strain on the structures that support the cables. When the air mass is acting on perpendicularly to the wires there is a greatest possible force applied to the wires. When the incidence is closest to the direction parallel to the wires, the smaller the force applied by wind pressure on the wires. Therefore, the greatest force is generated on the wires with the mass of air in the direction perpendicular to the lower and occurs in the direction parallel to the wires. Thus, objects that represent the groups of air mass are classified as cold air masses which can be {parallel, perpendicular and transversal} and hot air masses, which are {parallel, perpendicular and transversal}.
- Temperature: The southern region is where the greatest variations in temperature throughout the day are registered, due to its distance from the tropics and the fact that it is in the region of strong influence of masses of cold and warm air. This attribute has the bands measured in degrees Celsius {16, 17, 18, 19, 20, 21, 22, 23, 24, 25, 26, 27}.
- Land: The wind regime is influenced by factors such as topography and roughness of the land. This means that although the average values used, in some points these values can be smaller or larger. Ground can be differentiated into four categories, according to the coefficients of roughness that is: A) Vast expanses of water, shore plains and deserts plans; B) Ground open with few obstacles; C) Land with numerous small obstacles; D) lands and urbanized areas with many tall trees. The tracks which form the group of the attribute are {A, B, C, D}.
- Mechanical Capacity: To select a particular type of structure the efforts that it will be applied will be considered and this definition deliberates in the deployment project. Therefore, for this attribute is considered as a {high, low} mechanical capacity.
- Function Structure: Concerning this attribute, the structure can be applied as: {suspension or anchorage}, without considering intermediate possibilities. This item refers to the efforts that the tower is subjected, emphasizing that the anchorage compositions of the fittings are more enhanced than the suspension.
- Foundation Structure: It can be considered that there are two types of foundation concrete and metal foundation. The concrete can be in various formats, but always with a metal frame that makes its mooring and connection to the tower body. As the vast majority of concrete foundations applied are stub type, this term is used in this work comprehensively, referring to all varieties of concrete. Metal foundations also have different designs, but as to its shape, we can say that all are pyramidal. Among the pyramidal shape, the application is a larger metal grid type. The objects that form the group are classified into this attribute {stub, grid}.
For the classification of transmission lines in their susceptibility to failures we propose applying two different models. First, a logistic regression model will be applied and discussed. Then the automated neural network model will be developed. The comparison of the results obtained will be made via the area under the receiver operating characteristics curve known as the area under the curve (AUC). Fawcett [41T. Fawcett, "An introduction to ROC analysis", Pattern Recognit. Lett., vol. 27, no. 8, pp. 861-874, 2006.
[http://dx.doi.org/10.1016/j.patrec.2005.10.010] ] affirms that the ROC curve is a two dimensional depiction of a classifier performance. To compare classifiers we may want to reduce ROC performance to a single scalar value, the AUC, which has an important statistical property: the AUC of a classifier is equivalent to the probability that the classifier will rank a randomly chosen positive instance higher than a randomly chosen negative instance.
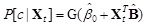
4. BINARY LOGISTIC REGRESSION MODELING
Regression modeling is one of several statistical techniques that enable an analyst to predict a response based upon a set of inputs. Linear regression models are commonly used when the range of the response is continuous, and can theoretically take any value. This model will be used to estimate the probability that a steel structure of transmission lines will fall due to certain conditions. As the output is restricted to the interval (0, 1), the assumption of an infinite range fails. An alternative is instead to use a logistic regression model [42D.W. Hosmer, S. Lemeshow, and R.X. Sturdivant, Applied Logistic Regression., 3rd ed. John Wiley & Sons: Hoboken, NJ, USA, 2013, p. 518.
[http://dx.doi.org/10.1002/9781118548387] ]. The common form for a logistic model is,
 |
(1) |
where P [c | Xt] is the conditional probability that the observation described by the input vector Xt is a member of class c. What makes the logistic equation appropriate for probability modelling is the use of the sigmoid or “s” function.
 |
(2) |
The sigmoid function in equation (2) is a continuous mapping of the real line on to the interval [0, 1]. While this interval is open with regards to the closed probability interval, it does create a method of modelling percentages and probabilities.
In order to compare more easily the logistic regression model to the feedforward Neural Network model, the logistic model can be described in a matrix form:
 |
(3) |
In this matrix form, XtT is the transpose of the vector of inputs,  is the vector of estimated parameters,
  is the estimated intercept term, and as before, G(o) represents the sigmoid function.
Although the purpose of this model is to predict the expected probability of steel structure rupture, the logistic regression model provides an additional benefit. This second use is its ability to provide insight into the model inputs or explanatory variables. The increase in the probability, in terms of the odds ratio, of a rupture when the variable is present is easily calculated rom the estimated parameters. If input variable i has an estimated parameter βi, the odds ratio can be calculated using equation (4).
 |
 |
(4) |
Whether a linear regression model or a feedforward neural network is chosen for the model, the response data are dichotomous. It is because of this ability to model dichotomous outputs that the logistic model is a common tool in many fields.
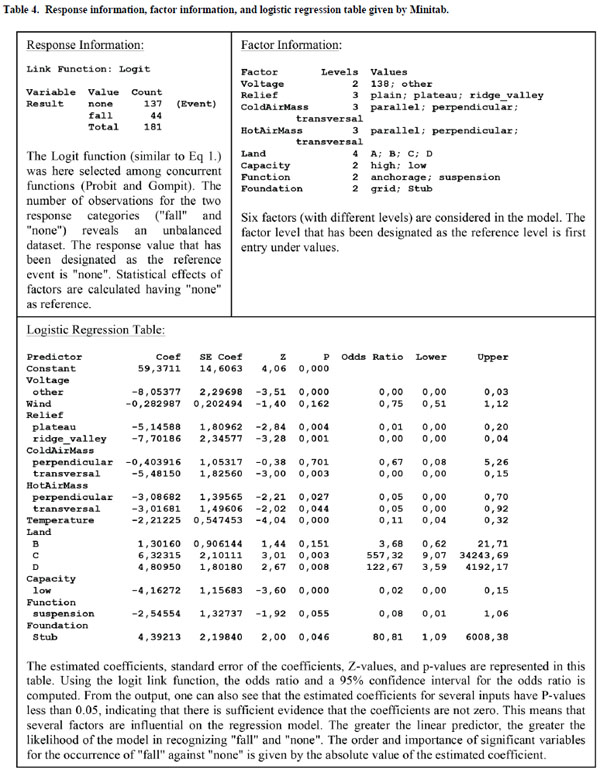
The main findings for the regression model for the steel structure (Table 1) are described in the following tables and graphs. Minitab software was used to run the analysis and comments are also included. Table 4 describes the response information, factor information and logistic regression table given by the Minitab results. Table 5 shows the Mintabresults for the G Statistic, Goodnesss-of-fit Tests, table of frequencies and Measures of association. Fig. (2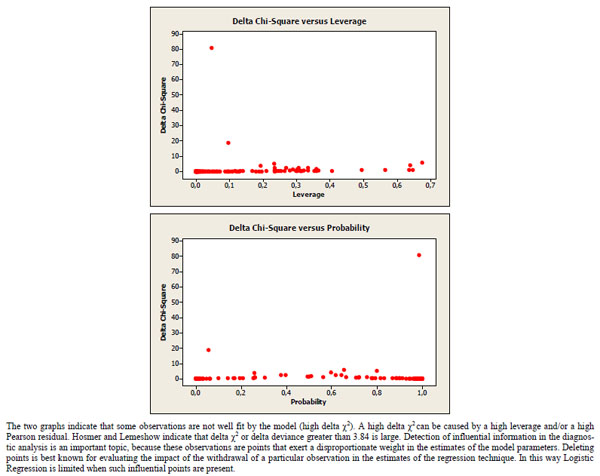 ) presents the Delta chi-square plots and their respective interpretation.
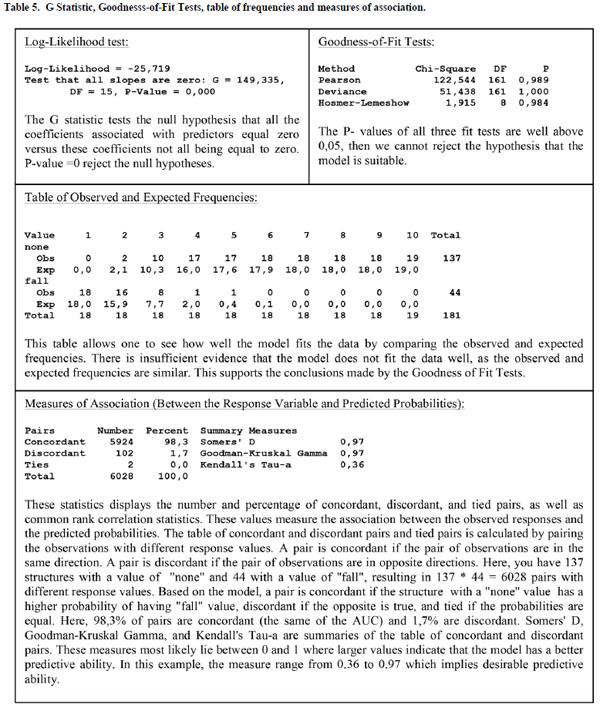 |
With the probabilities of occurrence of failures given by the LR, the ROC curve demonstrated in Fig. (3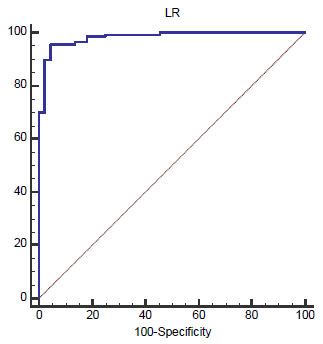 ) can be plotted. The calculated result for the AUC was of 0,983, which indicates an excelent perfomance for the classifier.
 |
Fig. (2) Delta Chi-Square plots and interpretation. |
5. ARTIFICIAL NEURAL NETWORKS MODELING
Artificial neural networks (ANNs) have been used increasingly as a promising modeling tool in almost all areas of human activities where quantitative approaches can be used to help decision making. They have already been treated as a standard nonlinear alternative to traditional models for pattern classification, time series analysis, and regression problems [43G.P. Zhang, "Avoiding Pitfalls in neural network research", IEEE Trans. Syst. Man Cybern. C, vol. 37, no. 1, pp. 3-16, 2007.
[http://dx.doi.org/10.1109/TSMCC.2006.876059] ].
ANNs were first used in the fields of cognitive science and engineering, are universal and highly flexible function approximators [44P.P. Balestrassi, E. Popova, A.P. Paiva, and J.W. Marangon Lima, "Design of experiments on neural network’s training for nonlinear time series forecasting", Neurocomputing, vol. 72, no. 4-6, pp. 1160-1178, 2009.
[http://dx.doi.org/10.1016/j.neucom.2008.02.002] ]. As cited by Tsay [45R.S. Tsay, Analysis of Financial Time Series., 3rd ed. Wiley and Sons: USA, 2010, p. 712.
[http://dx.doi.org/10.1002/9780470644560] ], ANNs are general and flexible tools for forecasting applications:
A popular topic in modern data analysis is ANN, which can be classified as a semiparametric method. As opposed to the model-based nonlinear methods, ANNs are data-driven approaches which can capture nonlinear data structures without prior assumption about the underlying relationship in a particular problem.
Fig. (4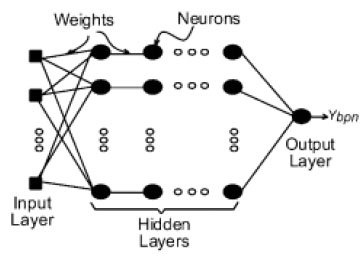 ) shows the ANN structure employed in the present study: A multilayer feedforward network trained with Backpropagation. The ANN has three types of layers, namely, the input layer, the output layer and the hidden layer, which is intermediate between the input and output layers. The number of hidden layers is usually one or two. Each layer consists of neurons, and the neurons in two adjacent layers are fully connected with respective weights, while the neurons within the same layer are not connected. In this paper, the output layer has just a single neuron, which represents the one-step forecasting based on previous points.
 |
Fig. (3) ROC curve of the LR classifier. |
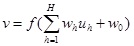
Each neuron in the input layer is designated to an attribute in the data, and produces an output which is equal to the (scaled) value of the corresponding attribute. For each neuron in the hidden or output layer, the following input-output transformation is employed:
 |
Fig. (4) Multilayer feedforward ANN structure. |
 |
(5) |
where v is the output, H is the total number of neurons in the previous layer, uh is the output of the hth neuron in the previous layer, wh is the corresponding connection weight, w0 is the bias (or intercept). fis the nonlinear transformation function (or activation function) also used in the output layer. The following transformation function, as example, is employed very often:
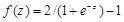 |
(6) |
When the ANN is trained using the Backpropagation algorithm the weights and biases are optimized. The objective function employed for optimization is the sum of the squares of the difference between a desirable output (ytarget) and an estimated output (ybpn).
Review of ANNs from statistical and econometric perspectives can be found in [46B. Cheng, and D.M. Titterington, "Neural networks: A review from a statistical perspective", Stat. Sci., vol. 9, no. 1, pp. 2-54, 1994.
[http://dx.doi.org/10.1214/ss/1177010638] ]. Today ANNs are used in a variety of modeling and forecasting problems. Although many models commonly used in real problems are linear, the nature of most real data sets suggests that nonlinear problems are more appropriate for forecasting and accurately describing it. ANN plays an important role for this kind of forecasting.
The literature on ANN is enormous and its applications spread over many scientific areas with varying degrees of success. In the M-Competition [47S. Makridakis, A. Andersen, R. Carbone, R. Fildes, M. Hibon, R. Lewandowski, J. Newton, E. Parzen, and R. Winkler, "The accuracy of extrapolation (time series) methods: Results of a forecasting competition", J. Forecast., vol. 1, no. 2, pp. 111-153, 1982.
[http://dx.doi.org/10.1002/for.3980010202] ], M2-Competition [48S. Makridakis, C. Chatfield, M. Hibon, M. Lawrence, T. Mills, K. Ord, and L.F. Simmons, "The M2-Competition : A real-time judgmentally based forecasting study", Int. J. Forecast., vol. 9, pp. 5-22, 1993.
[http://dx.doi.org/10.1016/0169-2070(93)90044-N] ] and M3-Competition [49S. Makridakis, and M. Hibon, "The M3-Competition : results, conclusions and implications", Int. J. Forecast., vol. 16, pp. 451-476, 2000.
[http://dx.doi.org/10.1016/S0169-2070(00)00057-1] ] many participants used ANNs. The main reason for this increased popularity of ANNs is that these models have been shown to be able to approximate almost any nonlinear function arbitrarily close.
Several factors have been considered in the literature when training ANNs. Table 6 presents the characteristic of the ANN constructed and details are given next. For the development of the net, the software Statistica (with Automated Neural Network toolbox) was employed (Statsoft, 2008).
1. ANN Architecture/Net. name: ANNs are nonlinear modeling algorithms. Examples of ANN for nonlinear time series are Multilayer Perceptrons (MLP), Radial Basis Function (RBF), Support Vector Machine (SVM), among many others. The multilayer perceptron is the most common form of network and the one used here. It requires iterative training, which may be quite slow for large number of hidden units and datasets, but the networks are quite compact, execute quickly once trained, and in most problems yield better results than the other types of networks. Each model has a name depending on its type, i.e. MLP (Multilayer Perceptron), number of inputs, number of neurons in the hidden layer, and the number of outputs. For example, the model named as MLP 23-13-2 refers to a multilayer perceptron network with 23 inputs, 13 neurons in each layer, and 2 outputs.
2. Training Performance/Test Performance: These columns indicate the performance of the network on the subsets used. The performance measure depends on the type of network target variable. For nominal variables (classification networks), the performance measure is the proportion of cases correctly classified, which is known as the classification rate.
3. Training Algorithm: This factor is related to the following training algorithm chosen for the MLP such as:
- Gradient Descent. Gradient descent is a first order optimization algorithm that attempts to move incrementally to successively lower points in search space in order to locate a minimum.
- Conjugate Descent. Conjugate descent is a fast training algorithm for multilayer perceptrons that proceeds by a series of line searches through error space. Succeeding search directions are selected to be conjugate (non-interfering). It is a good generic algorithm with generally fast convergence.
- BFGS. BFGS (Broyden-Fletcher-Goldfarb-Shanno, or Quasi-Newton) is a powerful second order training algorithm with very fast convergence but high memory requirements due to storing the Hessian matrix.
- The results present the algorithm used followed by the number of epochs for which the algorithm ran (if an iterative algorithm). For example, the code BFGS 27 indicates that the BFGS algorithm was used and that this network was found on the 27th cycle (the actual number of cycles used to train the model might be more than that).
4. Error Function: It indicates the error function used. It is either sum-of-squares (SOS) or Cross entropy (CE). CE is used for classification tasks only. SOS can be used for both classification and regression tasks.
5. Hidden Activation: This column indicates the activation function used for the hidden layer. Possible activation functions for MLP networks include Identity, Logistic, Tanh, Exponential, Sine.
- Identity. Uses the identity function. With this function, the activation level is passed on directly as the output of the neurons.
- Logistic. Uses the logistic sigmoid function. This is an S-shaped (sigmoid) curve, with output in the range (0,1).
- Tanh. Uses the hyperbolic tangent function (recommended). The hyperbolic tangent function (tanh) is a symmetric S-shaped (sigmoid) function, whose output lies in the range (-1, +1). Often performs better than the logistic sigmoid function because of its symmetry.
- Exp. Uses the negative exponential activation function.
- Sine. Uses the standard sine activation function.
6. Output Activation: Indicates the activation function used for the output layer. Possible activation functions for MLP type of networks include Identity, Logistic, Tanh, Exponential, Sine, and Softmax. Softmax activation functions are used with cross entropy error which be used only for classification tasks.
Fig. (5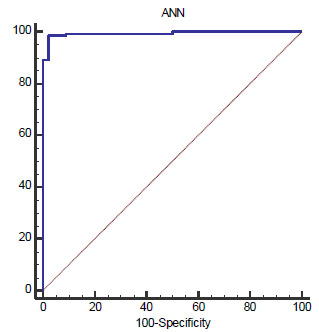 ) shows the receiver operating characteristics curve for the MLP 23-13-2. The area under the curve was of 0,994 demonstrating apparent superior performance when compared with the one obtained by the logistic regression (0,979) model.
Some papers have discussed how to test the statistical significance of the difference between the areas under two dependent ROC curves.The methods discussed in Hanley and McNeil’s [50J.A. Hanley, and B.J. McNeil, "A method of comparing the areas under receiver operating characteristic curves derived from the same cases", Radiology, vol. 148, no. 3, pp. 839-843, 1983.
[http://dx.doi.org/10.1148/radiology.148.3.6878708] [PMID: 6878708] ] work and in Delong et al. [51E.R. DeLong, D.M. DeLong, and D.L. Clarke-Pearson, "Comparing the areas under two or more correlated receiver operating characteristic curves: a nonparametric approach", Biometrics, vol. 44, no. 3, pp. 837-845, 1988.
[http://dx.doi.org/10.2307/2531595] [PMID: 3203132] ] are the most significant in revised papers. We tested the statistical significance of the difference according to both methodologies and the results are presented in Table 7. As demonstrated by the significance level (p-values > 0,05), there is insufficient evidence that one area is more expressive than the other. In other words, logistic regression and neural networks have both excellent and similar classification performances for the example under investigation. Fig. (6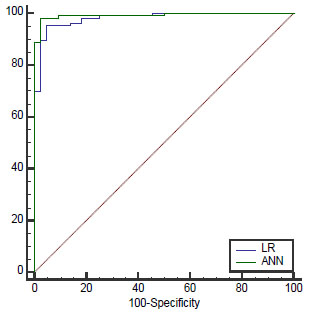 ) shows both curves plotted on the same graph.
 |
Fig. (5) ROC curve of the ANN classifier. |

 |
Fig. (6) LR and ANN ROC curves. |
6. CONCLUSION
In this paper, we discussed assessing the probability of occurrence of failures in steel structures of transmission lines through two different techniques: logistic regression and artificial neural networks to extract knowledge about which variables influence the mechanical behavior of the operating lines and can be used to diagnose potential falling towers. For the classification of transmission lines susceptible to failures, the following parameters have been considered: operating voltage, wind and relief of the region, air masses, temperature, land type, mechanical capacity, function and foundation structure.
The results of the logistic regression and neural networks modelling show a direction in relation to the structures that are more susceptible to fall. Analyzing the logistic regression results we can infer that variables with p-values inferior to (0,05) are significant and those with high coefficient absolute values influence more the outcome of interest. For example, relief p-values are very low while their coefficients are high, demonstrating that this variable has considerable influence on the outcome under investigation. On the other hand, wind p-value is high which implies irrelevant influence on the outcome. Thus, with these preliminaries evaluation of the structures vulnerable, studies and implementations of improvements and actions can be previously programmed, minimizing the costs of load shedding and avoiding high values of lost profits and damages. The risks and costs involved to a fallen tower for both the energy concession as for the general population are higher than acting preemptively.
Depending on the goals or the characteristics of the data one model can be more adequate than the other. The use of artificial neural networks may be particularly useful when the main goal is outcome classification and important interactions or complex nonlinearities exist in a data set, also it requires less formal statistical training and can be developed using multiple different training algorithms. A limitation of neural network models is that standardized coefficients and odds ratios corresponding to each variable cannot be easily calculated and presented as they are in regression models.
Logistic regression remains the clear choice when the primary goal of model development is to look for possible causal relationships between independent and dependent variables, and a modeler wishes to easily understand the effect of predictor variables on the outcome given that the model equation is also provided.
Numerically the performance of artificial neural networks was higher than logistic regression model. However, there was no statistical difference between them and both classifiers have excellent performances. In other words, it can be inferred that the performance of models selected by ANN and LR was quite similar, and the analytic methods were found to be roughly equivalent in terms of their classification ability as demonstrated by equivalent AUC graphs. The ANN methodology is more robust (i.e., it does not require a high level of operator judgment), and it uses a sophisticated nonlinear model to achieve high classification performance. On the other hand, logistic regression may generate many sets of models that yield similar performances, and the operator will need to make intellectual judgments to select the best models.
CONFLICT OF INTEREST
The authors confirm that this article content has no conflict of interest.
ACKNOWLEDGEMENTs
Declared none.
REFERENCES
| [1] | R.N. Wazen, T.S. Fernandes, A.R. Aoki, and W.E. de Souza, "Evaluation of the susceptibility of failures in steel structures of transmission lines", J. Control Autom. Electr. Syst., vol. 24, no. 1-2, pp. 174-186, 2013. [http://dx.doi.org/10.1007/s40313-013-0019-0] |
| [2] | G.P. Zhang, "Neural networks for classification: a survey", IEEE Trans. Syst. Man Cybern C Appl Rev., vol. 30, no. 4, pp. 451-462, 2000. |
| [3] | J.V. Tu, "Advantages and disadvantages of using artificial neural networks versus logistic regression for predicting medical outcomes", J. Clin. Epidemiol., vol. 49, no. 11, pp. 1225-1231, 1996. [http://dx.doi.org/10.1016/S0895-4356(96)00002-9] [PMID: 8892489] |
| [4] | M. Schumacher, R. Robner, and W. Vach, "Neural networks and logistic regression : Part I", Comput. Stat. Data Anal., vol. 21, pp. 661-682, 1996. [http://dx.doi.org/10.1016/0167-9473(95)00032-1] |
| [5] | W. Vach, R. Robner, and M. Schumacher, "Neural networks and logistic regression : Part II", Comput. Stat. Data Anal., vol. 21, no. 95, pp. 683-701, 1996. [http://dx.doi.org/10.1016/0167-9473(95)00033-X] |
| [6] | R.V. Freeman, K.A. Eagle, E.R. Bates, S.W. Werns, E. Kline-Rogers, D. Karavite, and M. Moscucci, "Comparison of artificial neural networks with logistic regression in prediction of in-hospital death after percutaneous transluminal coronary angioplasty", Am. Heart J., vol. 140, no. 3, pp. 511-520, 2000. [http://dx.doi.org/10.1067/mhj.2000.109223] [PMID: 10966555] |
| [7] | P. Leung, and L.T. Tran, "Predicting shrimp disease occurrence: artificial neural networks vs. logistic regression", Aquaculture, vol. 187, no. 1-2, pp. 35-49, 2000. [http://dx.doi.org/10.1016/S0044-8486(00)00300-8] |
| [8] | A. Borque, G. Sanz, C. Allepuz, L. Plaza, P. Gil, and L.A. Rioja, "The use of neural networks and logistic regression analysis for predicting pathological stage in men undergoing radical prostatectomy: a population based study", J. Urol., vol. 166, no. 5, pp. 1672-1678, 2001. [http://dx.doi.org/10.1016/S0022-5347(05)65651-0] [PMID: 11586200] |
| [9] | F.K. Chun, M. Graefen, A. Briganti, A. Gallina, J. Hopp, M.W. Kattan, H. Huland, and P.I. Karakiewicz, "Initial biopsy outcome prediction--head-to-head comparison of a logistic regression-based nomogram versus artificial neural network", Eur. Urol., vol. 51, no. 5, pp. 1236-1240, 2007. [http://dx.doi.org/10.1016/j.eururo.2006.07.021] [PMID: 16945477] |
| [10] | S. Kawakami, N. Numao, Y. Okubo, F. Koga, S. Yamamoto, K. Saito, Y. Fujii, J. Yonese, H. Masuda, K. Kihara, and I. Fukui, "Development, validation, and head-to-head comparison of logistic regression-based nomograms and artificial neural network models predicting prostate cancer on initial extended biopsy", Eur. Urol., vol. 54, no. 3, pp. 601-611, 2008. [http://dx.doi.org/10.1016/j.eururo.2008.01.017] [PMID: 18207312] |
| [11] | K.J. Ottenbacher, P.M. Smith, S.B. Illig, R.T. Linn, R.C. Fiedler, and C.V. Granger, "Comparison of logistic regression and neural networks to predict rehospitalization in patients with stroke", J. Clin. Epidemiol., vol. 54, no. 11, pp. 1159-1165, 2001. [http://dx.doi.org/10.1016/S0895-4356(01)00395-X] [PMID: 11675168] |
| [12] | T. Nguyen, R. Malley, S. Inkelis, and N. Kuppermann, "Comparison of prediction models for adverse outcome in pediatric meningococcal disease using artificial neural network and logistic regression analyses", J. Clin. Epidemiol., vol. 55, no. 7, pp. 687-695, 2002. [http://dx.doi.org/10.1016/S0895-4356(02)00394-3] [PMID: 12160917] |
| [13] | S.M. DiRusso, A.A. Chahine, T. Sullivan, D. Risucci, P. Nealon, S. Cuff, J. Savino, and M. Slim, "Development of a model for prediction of survival in pediatric trauma patients: comparison of artificial neural networks and logistic regression", J. Pediatr. Surg., vol. 37, no. 7, pp. 1098-1104, 2002. [http://dx.doi.org/10.1053/jpsu.2002.33885] [PMID: 12077780] |
| [14] | S. Dreiseitl, and L. Ohno-Machado, "Logistic regression and artificial neural network classification models: a methodology review", J. Biomed. Inform., vol. 35, no. 5-6, pp. 352-359, 2002. [http://dx.doi.org/10.1016/S1532-0464(03)00034-0] [PMID: 12968784] |
| [15] | M. Hajmeer, and I. Basheer, "Comparison of logistic regression and neural network-based classifiers for bacterial growth", Food Microbiol., vol. 20, no. 1, pp. 43-55, 2003. [http://dx.doi.org/10.1016/S0740-0020(02)00104-1] |
| [16] | K.J. Ottenbacher, R.T. Linn, P.M. Smith, S.B. Illig, M. Mancuso, and C.V. Granger, "Comparison of logistic regression and neural network analysis applied to predicting living setting after hip fracture", Ann. Epidemiol., vol. 14, no. 8, pp. 551-559, 2004. [http://dx.doi.org/10.1016/j.annepidem.2003.10.005] [PMID: 15350954] |
| [17] | C-C. Lin, Y-K. Ou, S-H. Chen, Y-C. Liu, and J. Lin, "Comparison of artificial neural network and logistic regression models for predicting mortality in elderly patients with hip fracture", Injury, vol. 41, no. 8, pp. 869-873, 2010. [http://dx.doi.org/10.1016/j.injury.2010.04.023] [PMID: 20494353] |
| [18] | U.U. Ergün, S. Serhatlioğlu, F. Hardalaç, and I. Güler, "Classification of carotid artery stenosis of patients with diabetes by neural network and logistic regression", Comput. Biol. Med., vol. 34, no. 5, pp. 389-405, 2004. [http://dx.doi.org/10.1016/S0010-4825(03)00085-4] [PMID: 15145711] |
| [19] | E. Yesilnacar, and T. Topal, "Landslide susceptibility mapping: A comparison of logistic regression and neural networks methods in a medium scale study, Hendek region (Turkey)", Eng. Geol., vol. 79, no. 3-4, pp. 251-266, 2005. [http://dx.doi.org/10.1016/j.enggeo.2005.02.002] |
| [20] | I. Yilmaz, "Landslide susceptibility mapping using frequency ratio, logistic regression, artificial neural networks and their comparison: A case study from Kat landslides (Tokat—Turkey)", Comput. Geosci., vol. 35, no. 6, pp. 1125-1138, 2009. [http://dx.doi.org/10.1016/j.cageo.2008.08.007] |
| [21] | B. Pradhan, and S. Lee, "Landslide susceptibility assessment and factor effect analysis: backpropagation artificial neural networks and their comparison with frequency ratio and bivariate logistic regression modelling", Environ. Model. Softw., vol. 25, no. 6, pp. 747-759, 2010. [http://dx.doi.org/10.1016/j.envsoft.2009.10.016] |
| [22] | J. Choi, H-J. Oh, H-J. Lee, C. Lee, and S. Lee, "Combining landslide susceptibility maps obtained from frequency ratio, logistic regression, and artificial neural network models using ASTER images and GIS", Eng. Geol., vol. 124, pp. 12-23, 2012. [http://dx.doi.org/10.1016/j.enggeo.2011.09.011] |
| [23] | J.H. Song, S.S. Venkatesh, E.A. Conant, P.H. Arger, and C.M. Sehgal, "Comparative analysis of logistic regression and artificial neural network for computer-aided diagnosis of breast masses", Acad. Radiol., vol. 12, no. 4, pp. 487-495, 2005. [http://dx.doi.org/10.1016/j.acra.2004.12.016] [PMID: 15831423] |
| [24] | C.E. McLaren, W-P. Chen, K. Nie, and M-Y. Su, "Prediction of malignant breast lesions from MRI features: a comparison of artificial neural network and logistic regression techniques", Acad. Radiol., vol. 16, no. 7, pp. 842-851, 2009. [http://dx.doi.org/10.1016/j.acra.2009.01.029] [PMID: 19409817] |
| [25] | M. Green, J. Björk, J. Forberg, U. Ekelund, L. Edenbrandt, and M. Ohlsson, "Comparison between neural networks and multiple logistic regression to predict acute coronary syndrome in the emergency room", Artif. Intell. Med., vol. 38, no. 3, pp. 305-318, 2006. [http://dx.doi.org/10.1016/j.artmed.2006.07.006] [PMID: 16962295] |
| [26] | W.K. Chiang, D. Zhang, and L. Zhou, "Predicting and explaining patronage behavior toward web and traditional stores using neural networks: a comparative analysis with logistic regression", Decis. Support Syst., vol. 41, no. 2, pp. 514-531, 2006. [http://dx.doi.org/10.1016/j.dss.2004.08.016] |
| [27] | P-L. Liew, Y-C. Lee, Y-C. Lin, T-S. Lee, W-J. Lee, W. Wang, and C-W. Chien, "Comparison of artificial neural networks with logistic regression in prediction of gallbladder disease among obese patients", Dig. Liver Dis., vol. 39, no. 4, pp. 356-362, 2007. [http://dx.doi.org/10.1016/j.dld.2007.01.003] [PMID: 17317348] |
| [28] | P.A. Gutiérrez, F. López-Granados, J.M. Peña-Barragán, M. Jurado-Expósito, and C. Hervás-Martínez, "Logistic regression product-unit neural networks for mapping Ridolfia segetum infestations in sunflower crop using multitemporal remote sensed data", Comput. Electron. Agric., vol. 64, no. 2, pp. 293-306, 2008. [http://dx.doi.org/10.1016/j.compag.2008.06.001] |
| [29] | I. Kurt, M. Ture, and A.T. Kurum, "Comparing performances of logistic regression, classification and regression tree, and neural networks for predicting coronary artery disease", Expert Syst. Appl., vol. 34, no. 1, pp. 366-374, 2008. [http://dx.doi.org/10.1016/j.eswa.2006.09.004] |
| [30] | A. Al Housseini, T. Newman, A. Cox, and L.D. Devoe, "Prediction of risk for cesarean delivery in term nulliparas: a comparison of neural network and multiple logistic regression models", Am. J. Obstet. Gynecol., vol. 201, no. 1, pp. 113.e1-113.e6, 2009. [http://dx.doi.org/10.1016/j.ajog.2009.05.001] [PMID: 19576377] |
| [31] | G. Caocci, R. Baccoli, A. Vacca, A. Mastronuzzi, A. Bertaina, E. Piras, R. Littera, F. Locatelli, C. Carcassi, and G. La Nasa, "Comparison between an artificial neural network and logistic regression in predicting acute graft-vs-host disease after unrelated donor hematopoietic stem cell transplantation in thalassemia patients", Exp. Hematol., vol. 38, no. 5, pp. 426-433, 2010. [http://dx.doi.org/10.1016/j.exphem.2010.02.012] [PMID: 20206661] |
| [32] | M. Pavlekovic, M. Bensic, and M. Zekic-Susac, "Modeling children’s mathematical gift by neural networks and logistic regression", Expert Syst. Appl., vol. 37, no. 10, pp. 7167-7173, 2010. [http://dx.doi.org/10.1016/j.eswa.2010.04.016] |
| [33] | L. Trtica-Majnaric, M. Zekic-Susac, N. Sarlija, and B. Vitale, "Prediction of influenza vaccination outcome by neural networks and logistic regression", J. Biomed. Inform., vol. 43, no. 5, pp. 774-781, 2010. [http://dx.doi.org/10.1016/j.jbi.2010.04.011] [PMID: 20451660] |
| [34] | H. Chen, J. Zhang, Y. Xu, B. Chen, and K. Zhang, "Performance comparison of artificial neural network and logistic regression model for differentiating lung nodules on CT scans", Expert Syst. Appl., vol. 39, no. 13, pp. 11503-11509, 2012. [http://dx.doi.org/10.1016/j.eswa.2012.04.001] |
| [35] | A. Larasati, C. DeYong, and L. Slevitch, "The application of neural network and logistics regression models on predicting customer satisfaction in a student-operated restaurant", Procedia Soc. Behav. Sci., vol. 65, pp. 94-99, 2012. [http://dx.doi.org/10.1016/j.sbspro.2012.11.097] |
| [36] | H. Pourshahriar, "Correct vs. accurate prediction: A comparison between prediction power of artificial neural networks and logistic regression in psychological researches", Procedia Soc. Behav. Sci, vol. 32, no. 2011, pp. 97-103, 2012. [http://dx.doi.org/10.1016/j.sbspro.2012.01.017] |
| [37] | B. Swiderski, J. Kurek, and S. Osowski, "Multistage classification by using logistic regression and neural networks for assessment of financial condition of company", Decis. Support Syst., vol. 52, no. 2, pp. 539-547, 2012. [http://dx.doi.org/10.1016/j.dss.2011.10.018] |
| [38] | O.E. Askin, and F. Gokalp, "Comparing the predictive and classification performances of logistic regression and neural networks: a case study on timss 2011", Procedia Soc. Behav. Sci., vol. 106, pp. 667-676, 2013. [http://dx.doi.org/10.1016/j.sbspro.2013.12.076] |
| [39] | A. Morteza, M. Nakhjavani, F. Asgarani, F.L. Carvalho, R. Karimi, and A. Esteghamati, "Inconsistency in albuminuria predictors in type 2 diabetes: a comparison between neural network and conditional logistic regression", Transl. Res., vol. 161, no. 5, pp. 397-405, 2013. [http://dx.doi.org/10.1016/j.trsl.2012.12.013] [PMID: 23333109] |
| [40] | J.A. Vallejos, and S.D. McKinnon, "Logistic regression and neural network classification of seismic records", Int. J. Rock Mech. Min. Sci., vol. 62, pp. 86-95, 2013. [http://dx.doi.org/10.1016/j.ijrmms.2013.04.005] |
| [41] | T. Fawcett, "An introduction to ROC analysis", Pattern Recognit. Lett., vol. 27, no. 8, pp. 861-874, 2006. [http://dx.doi.org/10.1016/j.patrec.2005.10.010] |
| [42] | D.W. Hosmer, S. Lemeshow, and R.X. Sturdivant, Applied Logistic Regression., 3rd ed. John Wiley & Sons: Hoboken, NJ, USA, 2013, p. 518. [http://dx.doi.org/10.1002/9781118548387] |
| [43] | G.P. Zhang, "Avoiding Pitfalls in neural network research", IEEE Trans. Syst. Man Cybern. C, vol. 37, no. 1, pp. 3-16, 2007. [http://dx.doi.org/10.1109/TSMCC.2006.876059] |
| [44] | P.P. Balestrassi, E. Popova, A.P. Paiva, and J.W. Marangon Lima, "Design of experiments on neural network’s training for nonlinear time series forecasting", Neurocomputing, vol. 72, no. 4-6, pp. 1160-1178, 2009. [http://dx.doi.org/10.1016/j.neucom.2008.02.002] |
| [45] | R.S. Tsay, Analysis of Financial Time Series., 3rd ed. Wiley and Sons: USA, 2010, p. 712. [http://dx.doi.org/10.1002/9780470644560] |
| [46] | B. Cheng, and D.M. Titterington, "Neural networks: A review from a statistical perspective", Stat. Sci., vol. 9, no. 1, pp. 2-54, 1994. [http://dx.doi.org/10.1214/ss/1177010638] |
| [47] | S. Makridakis, A. Andersen, R. Carbone, R. Fildes, M. Hibon, R. Lewandowski, J. Newton, E. Parzen, and R. Winkler, "The accuracy of extrapolation (time series) methods: Results of a forecasting competition", J. Forecast., vol. 1, no. 2, pp. 111-153, 1982. [http://dx.doi.org/10.1002/for.3980010202] |
| [48] | S. Makridakis, C. Chatfield, M. Hibon, M. Lawrence, T. Mills, K. Ord, and L.F. Simmons, "The M2-Competition : A real-time judgmentally based forecasting study", Int. J. Forecast., vol. 9, pp. 5-22, 1993. [http://dx.doi.org/10.1016/0169-2070(93)90044-N] |
| [49] | S. Makridakis, and M. Hibon, "The M3-Competition : results, conclusions and implications", Int. J. Forecast., vol. 16, pp. 451-476, 2000. [http://dx.doi.org/10.1016/S0169-2070(00)00057-1] |
| [50] | J.A. Hanley, and B.J. McNeil, "A method of comparing the areas under receiver operating characteristic curves derived from the same cases", Radiology, vol. 148, no. 3, pp. 839-843, 1983. [http://dx.doi.org/10.1148/radiology.148.3.6878708] [PMID: 6878708] |
| [51] | E.R. DeLong, D.M. DeLong, and D.L. Clarke-Pearson, "Comparing the areas under two or more correlated receiver operating characteristic curves: a nonparametric approach", Biometrics, vol. 44, no. 3, pp. 837-845, 1988. [http://dx.doi.org/10.2307/2531595] [PMID: 3203132] |