- Home
- About Journals
-
Information for Authors/ReviewersEditorial Policies
Publication Fee
Publication Cycle - Process Flowchart
Online Manuscript Submission and Tracking System
Publishing Ethics and Rectitude
Authorship
Author Benefits
Reviewer Guidelines
Guest Editor Guidelines
Peer Review Workflow
Quick Track Option
Copyediting Services
Bentham Open Membership
Bentham Open Advisory Board
Archiving Policies
Fabricating and Stating False Information
Post Publication Discussions and Corrections
Editorial Management
Advertise With Us
Funding Agencies
Rate List
Kudos
General FAQs
Special Fee Waivers and Discounts
- Contact
- Help
- About Us
- Search


The Open Fuels & Energy Science Journal
(Discontinued)
ISSN: 1876-973X ― Volume 11, 2018
Numerical Simulation of Several Parameters of Distribution Uniformity of Tracer Gas in Stope
Yiyuan Cui*, Mingran Chang
Abstract
Tracer gas technology is an effective way to evaluate underground coal mine ventilation system, especially in stope, air leakage from working face to gob can be quickly detected by this method. While tracer gas distribution characteristics may be different with the variation of ventilation parameters, therefore, ascertaining the uniform distributed location as sampling point is essential to improve the measuring accuracy of tracer gas technology. This study conducts simulations of tracer gas distribution in four ventilation models with different parameters, aiming to analyze the effects of gob and height difference between roadway and working face on tracer gas distribution uniformity. The result shows the porous characteristics of gob is not conductive to tracer gas uniform distribution, the height difference between roadway and working face increases the turbulence intensity of airflow and promotes the uniform distribution of tracer gas. In no height difference stope, tracer gas and airflow can be mixed uniformly at 5D of return roadway, but in height difference stope, only 1D is required. Finally, a practical case study is conducted to verify the validity of simulation.
Article Information

Identifiers and Pagination:
Year: 2017Volume: 10
First Page: 107
Last Page: 115
Publisher Id: TOEFJ-10-107
DOI: 10.2174/1876973X01710010107
Article History:
Received Date: 02/08/2016Revision Received Date: 14/12/2016
Acceptance Date: 14/12/2016
Electronic publication date: 29/12/2017
Collection year: 2017
open-access license: This is an open access article licensed under the terms of the Creative Commons Attribution-Non-Commercial 4.0 International Public License (CC BY-NC 4.0) (https://creativecommons.org/licenses/by-nc/4.0/legalcode), which permits unrestricted, non-commercial use, distribution and reproduction in any medium, provided the work is properly cited.
* Address correspondence to this author at the School of Resource and Safety Engineering, China University of Mining and Technology (Beijing), Ding on the 11th, Xueyuan Road, Haidian District, Beijing, 100083, China; Tel: +86 18813150978; E-mail: tsuiyiy@163.com
| Open Peer Review Details | |||
|---|---|---|---|
| Manuscript submitted on 02-08-2016 |
Original Manuscript | Numerical Simulation of Several Parameters of Distribution Uniformity of Tracer Gas in Stope | |
1. INTRODUCTION
The spontaneous combustion of residual coal in gob is one of the major causes, which results in underground coal mine fire [1Yuan, L.; Smith, A.C. Numerical study on effects of coal properties on spontaneous heating in longwall gob areas. Fuel, 2008, 87(15), 3409-3419.
[http://dx.doi.org/10.1016/j.fuel.2008.05.015] ]. For a long time, frequent coal mine fire accidents in China have not only caused tremendous casualties and property losses, but also seriously restricted the healthy development of coal mine industries. An important factor to cause spontaneous combustion of residual coal is the continuous air leakage from working face to gob. Therefore, studying the air leakage in gob is crucial to prevent coal mine fire accidents and improve the safety management level of coal mine.
Tracer gas is an effective way to evaluate the ventilation system that has been widely used in buildings and underground mines [2Dick, J.B. Measurement of ventilation using tracer gas. Heat. Piping Air Cond., 1950, 22(5), 131-137.-8Arpa, G.; Widiatmojo, A.; Widodo, N.P.; Sasaki, K. Tracer gas measurement and simulation of turbulent diffusion in mine ventilation roadways. J. Coal Sci. Eng. (China), 2008, 14(4), 523-529.
[http://dx.doi.org/10.1007/s12404-008-0401-x] ]. The sulfur hexafluoride (SF6) is widely accepted as a standard mine ventilation tracer, because it can be detected in low concentrations and does not exist in coal mine environment [9Thimons, E.D.; Kissell, F.N. Tracer Gas as an Aid in Mine Ventilation Analysis (No. BM-RI-7917); Bureau of Mines: Washington, DC, USA, 1974. ]. Recently, many researches have been conducted by applying this technique including evaluating the coal mine ventilation networks and the characteristics of airflow in gob [10Grenier, M.G.; Hardcastle, S.G.; Kunchur, G.; Butler, K. The use of tracer gases to determine dust dispersion patterns and ventilation parameters in a mineral processing plant. Am. Ind. Hyg. Assoc. J., 1992, 53(6), 387-394.
[http://dx.doi.org/10.1080/15298669291359825] [PMID: 1605111] -12Patterson, R.; Luxbacher, K. Tracer gas applications in mining and implications for improved ventilation characterisation. Int. J. Min. Reclam. Environ, 2012, 26(4), 337-350.
[http://dx.doi.org/10.1080/17480930.2011.639188] ]. However, during applications, field engineers found that the distribution of tracer gas has great influence on the measurement result. If the sampling location is set to the point where tracer gas doesn’t distribute uniformly, the measurement result will be not accurate. Therefore, studying the distribution characteristics of tracer gas and determining the appropriate sampling location are quite essential for the application of tracer gas technique.
Some pipeline experiments were conducted to research the distribution characteristics of tracer gas. The results of these experiments show that the structure of pipe has great influence on tracer gas distribution [13Wang, H.Q. Theory and application in mine ventilation of tracer gas measurement. Ind. Saf. Dust Control, 2000, 2, 11-13., 14Zheng, M.G.; Zeng, X.Y.; Chi, Z.H.; Wang, J.Q. Numerical simulations and experimental study of the mixing uniformity of tracer gas in 90° bend pipe. J. China Univ. Metrol., 2011, 22(4), 332-336.]. If applying tracer gas technique to mining stope air leak detection, some unique features of roadway and working face should be taken fully consideration. For this sake, the objective of this study is to research the influence of different factors on the distribution of tracer gas in mining stope by using CFD simulation. Firstly, four U-type ventilation models with different parameters are constructed. Then, standard k-ε model is applied in Computational Fluid Dynamic Fluent to simulate the migration of SF6 with airflow. The contours of SF6 of different cross sections in return roadway are compared and analyzed to describe the effects of gob and height difference on tracer gas distribution. At last, a case study is conducted to verify the validity of simulation, and the appropriate sampling locations are determined.
2. MODEL CONSTRUCTION
Simulations are conducted in a typical U-type ventilation stope, the length of working face is 160m, two 30m roadways are connected to the working face as intake and return airways. The average cross sectional dimensions of roadways are both 3×4m. Considering the deep part of gob has little influence on the working face airflow, the length of gob takes 40m in simulation. To study the effects of height difference between roadway and working face and porous characteristics of gob on tracer gas distribution, four models are constructed as Fig. (1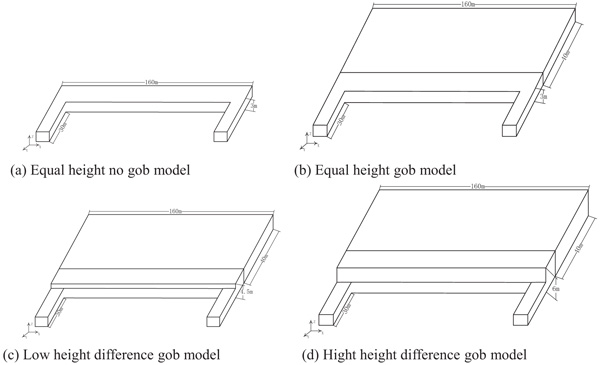 ).
).
 |
Fig. (1) Structure of four different models. |
Model 1# is an equal height and no gob model as shown in Fig. (1a), Model 2# is an equal height and gob model as shown in Fig. (1b), Model 3# is a 1.5m different height and gob model as shown in Fig. (1c), Model 4# is a 3m different height and gob model as shown in Fig. (1d). The influence of gob will be demonstrated by comparison of Model 1# and Model 2#, and then influence of height difference will be shown by comparison of Model 2#, Model 3# and Model 4#.
2.1. Basic Assumptions
In order to facilitate the establishment of CFD model, some assumptions should be made to simplify problems. According to the focus of this research, it is assumed that:
- The air is incompressible.
- The airflow is turbulent flow and its velocity is constant.
- Air temperature is constant, and there is no heat transfer from wall or coal particles.
- The release device of SF6 and operator do not influence the inlet airflow.
These assumptions are all made based on the study focus, the real situation is more complex than simulation. Actually, many mining conditions are also simplified in these models, such as the influence of apparatus in working face, the slow movement of working face.
2.2. Governing Equation
The basis of CFD simulation is to construct governing equation of fluid dynamic. Generally, the governing equations include momentum equations, energy equations and continuity equations. Based on the assumptions of above section, energy equation is not applied since the fluid is assumed to be incompressible and no heat transfer in simulation. Only continuity equation and momentum equation are taken into consideration, which can be expressed as:
 |
(1) |
Where, φt is the general variable of interest, ρt is the air density, Γφt is the diffusive coefficient, and Sφt is the source term.
The standard k-ε model, RNG k-ε model and realizable k-ε model are three commonly used models to describe the turbulence of fluid. In this study, a standard two equations k-ε model is employed to simulate the airflow and tracer gas migration. For stable and incompressible gas, the standard k-ε equation is:
 |
(2) |
 |
(3) |
 |
(4) |
 |
(5) |
Where Gk is the turbulent kinetic energy generated by laminar velocity gradient; Yk and Yw is the turbulent generated by diffusion; σk and σw is the energy of the turbulent Prandtl number of k,w equations; ut is the turbulent viscosity.
2.3. Basic Approach and Boundary Conditions of Simulation
The inlet of intake roadway and SF6 release port were set to velocity inlet. The outlet of return roadway was set to outflow. The intake airflow rate was assumed to be 1200m3/min. The release point of SF6 was set in intake roadway, 10m away from working face. The release rate was 10L/min. The solver was set to segregated and a standard two equation k-ε model was introduced to simulate tracer gas and airflow migration. To acquire a more accurate result, the second order upwind was adopted to calculate momentum, turbulent kinetic energy, turbulent dissipation rate and mass of SF6. The solver PRESTO! was used for pressure calculation due to the porous zone and 90º bend zone in these models. SIMPLEC algorithm was introduced to couple governing equations. Considering the density difference between SF6 and air, the gravity was set to be 9.81m/s2 in negative Z direction. The interface between working face and gob was set as interior, and the rest surfaces were set as stationary walls with no slip. Both air and wall temperature was assumed to be constant. The settings of this simulation are listed in the Table 1.

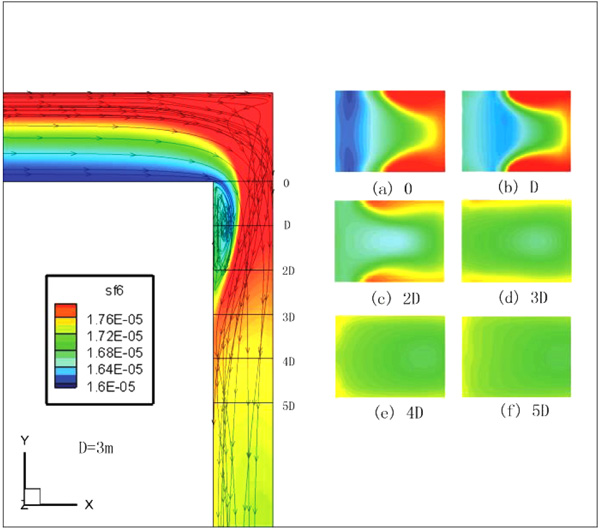 |
Fig. (2) SF6 concentrations in return roadway of Model 1#. |
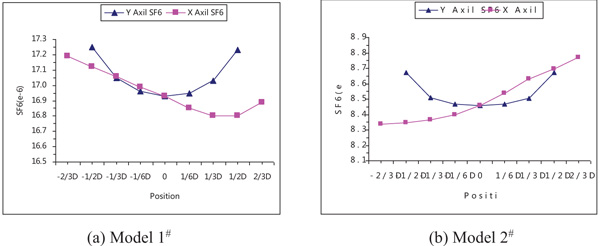 |
Fig. (3) SF6 concentrations in return roadway of Model 2#. |
3. RESULTS AND ANALYSIS
The contours of SF6 and the flow path of Model 1# and Model 2# are shown in Figs. (2 and 3
and 3 ), respectively. In these two Figures, D stands for the height of roadway, which is 3 meters. According to the flow path lines, it can be seen that the flow features in return roadways are very similar. Both of the two models have circular flow directions adjacent to working face at the head of return roadway. The circular flow leads to tracer gas recirculates and SF6 concentrations in this zone is relative low. But small differences also can be seen by comparing these two results. From the flow path lines, the airflow in Model 1# hits the right side of roadway and turns sharply back to the left side of roadway, however the airflow in Model 2# turns smoothly and goes into the roadway close to the right side. This is because the airflow leaks into the gob zone, the total airflow rate in working face decreases, so that airflow in Model 2# hits the right wall not as fierce as airflow in Model 1#. As a result, tracer gas in Model 1# is easier to distribute uniformly than in Model 2#. From the contours of SF6 concentrations in vertical, the tracer gas and airflow are mixed uniformly between 3D and 4D in Model 1#, while in Model 2#, they are mixed uniformly between 4D and 5D. In order to further verify the validity of simulation, the concentrations of SF6 in X and Y axial direction at 4D are presented in Fig. (4
 ). In Model 1#, the deviations between maximum concentration and minimum concentration are 1.75% in X axial and 1.86% in Y axial, respectively. However, in Model 2#, the deviations are 2.52% in X axial and 4.94% in Y axial, respectively. It is proved that the porous characteristics of gob are not conductive to uniformly distribution of trace gas.
 |
Fig. (4) X axial and Y axial concentrations of 4D in Model 1# and Model 2#. |
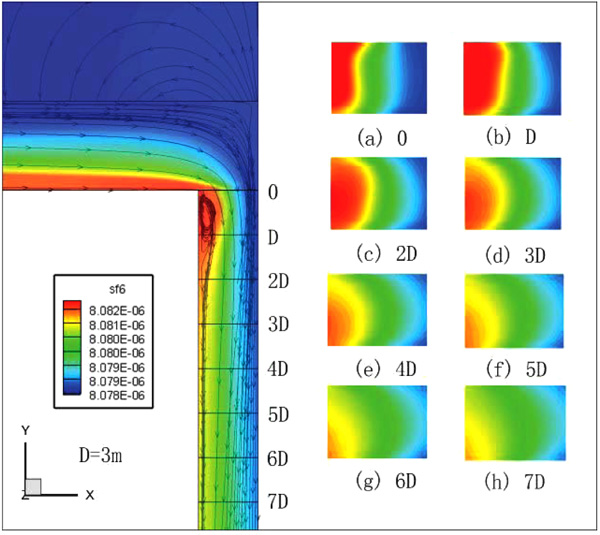 |
Fig. (5) SF6 concentrations in return roadway of Model 3#. |
The contours of SF6 concentrations and the flow path of Model 3# and Model 4# are shown in Figs. (5 and 6
and 6 ), respectively. The height difference between roadway and working face makes the distribution of tracer gas remarkably distinct from Model 1# and Model 2#. Firstly, the area of circular flow decreases, and then the original high concentration zones move from right side to left side of return roadways. Comparing the overall flow path lines of Model 2#, Model 3# and Model 4# (Fig. 7
 ), It can be seen that the height difference leads to the increase of turbulence intensity. Analyzing the section cross concentration, the concentration distribution of each distance remains unchanged and the concentration in whole cross section is basically identical, which means airflow and tracer gas are fully mixed. Therefore, the height difference between roadway and working face is advantageous to tracer gas distribution uniformly.
 |
Fig. (6) SF6 concentrations in return roadway of Model 4#. |
 |
Fig. (7) Comparison of flow path lines of different height difference. |
Based on the simulation results, SF6 concentration is not higher at the bottom of these four models. This indicates that although SF6 is heavier than air, it does not necessarily concentrate at the bottom since air flow features can overcome gravitational influences. This is the same with the conclusion of Xu [6Xu, G.; Jong, E.C.; Luxbacher, K.D.; Ragab, S.A.; Karmis, M.E. Remote characterization of ventilation systems using tracer gas and CFD in an underground mine. Saf. Sci., 2015, 74, 140-149.
[http://dx.doi.org/10.1016/j.ssci.2015.01.004] ].
4. CASE STUDY
4.1. Working Conditions and On-site Air Leakage Detection
In order to verify the validity of the simulation, a case study was demonstrated in this paper. The basic working conditions of 8201 working face are shown in Table 2.

The cross section unit method was applied to detect the accurate air leakage rate of present stage. The working face was divided into several units, and the inlet air rate and outlet air rate of each unit could be measured by airflow meter (Fig. 8 ). Therefore, the air leakage rate of each unit can be calculated by:
 |
Fig. (8) Cross section method to detect working face air leakage rate. |
 |
(6) |
where Qi is the air leakage volume of each unit, m3/min, Qinleti is the inlet air rate of the ith unit, m3/min, Qoutleti is the outlet air rate of the ith unit. The accumulation of Qi is the air leakage distribution of working face.
In this study, the units of working face were divided on basis of the distribution of hydraulic supports. The 8201 working face has 102 hydraulic supports, and the width of each hydraulic support is 1.5m. Every 5 supports are set to be one unit, then the wind speed and airflow rate could be measured (Table 3). It can be seen that airflow rate varies greatly at the both ends of the working face. The total air leakage rate is the highest volume minus the lowest volume, which is 95.02m3/min in this detection, occupying 14.43% of total airflow volume.
4.2. Simulation and Results
As can be seen in Table 3, the height difference between working face and roadway is less than 10% of the height of roadway, which means the height difference can be omitted. Therefore, the Model 2# can be applied to construct CFD simulation model in this case. Assuming that the release rate of SF6 is 10L/min, it can be calculated that the initial concentration of tracer is 15150ppb. The release time is set to be 10s. Based on the simulation result of Model 2#, the appropriate sampling point should be set between 4D and 5D of the return roadway. To verify the validity of simulation, the concentration-time curves at the centers of 3D, 4D and 5D are demonstrated. The tracer concentration-time curves of different cross sections are shown in Fig. (9 ). The peak of each curve can be used to indicate airflow that directly flow pass the working face, so the airflow leaking into the gob can be calculated by:

 |
(7) |
where Qleak is the air rate leaking into the gob, Cinital is the tracer concentration of inlet airflow, Cpeak is the tracer concentration of sampling point, Qinlet is the air rate of intake roadway.
In Fig. (9), the peaks of each curve are 11600ppb(3D), 12500ppb(4D) and 12800ppb(5D). The calculation results of air leakage rate based on Eq. (7) are: Qleak~3D is 154.6m3/min, Qleak~4D is 115.44m3/min, Qleak~5D is 102.376m3/min. It can be seen that even there is still some errors, the result at 5D cross section is more close to the measured value. The occurrence of errors may be because hydraulic support was not considered in the modeling of CFD.
 |
Fig. (9) SF6 concentration-time curves of different cross sections. |
CONCLUSION
In this study, CFD simulation is conducted for the analysis of the effects of gob and height difference between roadway and working face on tracer gas distribution in mine stope. Four U-type ventilation models are constructed to research this problem. SF6 is used as tracer gas and its distribution characteristics in return roadway were simulated and discussed. Some useful conclusions can be drawn as follows:
- The porous characteristics of gob is not conductive to tracer gas uniform distribution. In the no gob and equal height model, tracer gas and airflow can be mixed uniformly at 4D of return roadway, while if gob zone exists, this distance needs to be 5D or more.
- The height difference between roadway and working face contributes to raise the mixing rate of airflow and tracer gas because of the effect of high turbulence. In the models of height difference, tracer gas and airflow can be mixed uniformly at 1D of return roadway.
- Although SF6 is heavier than air, it does not necessarily concentrate at the bottom since airflow features can overcome gravitational influences. So tracer gas can be sampled at any point of the evenly distribution cross section.
CONFLICT OF INTEREST
The authors confirm that this article content has no conflict of interest.
ACKNOWLEDGEMENTS
Declared none.
REFERENCES
| [1] | Yuan, L.; Smith, A.C. Numerical study on effects of coal properties on spontaneous heating in longwall gob areas. Fuel, 2008, 87(15), 3409-3419. [http://dx.doi.org/10.1016/j.fuel.2008.05.015] |
| [2] | Dick, J.B. Measurement of ventilation using tracer gas. Heat. Piping Air Cond., 1950, 22(5), 131-137. |
| [3] | Kennedy, D.J.; Stokes, A.W.; Klinowski, W.G. Resolving complex mine ventilation problems with multiple tracer gases. In: 3rd Mine Vent. Symp; University Park, Pennsylvania, 1987; pp. 213-218. |
| [4] | Klinowski, W.G.; Kennedy, D.J. Tracer gas techniques used in mine ventilation. In: Proceedings of the 5th US Mine Ventilation Symposium; Morgantown, WV, 1991; pp. 1-5. |
| [5] | Widodo, N.P.; Sasaki, K.; Gautama, R.S. Risono., Mine ventilation measurements with tracer gas method and evaluations of turbulent diffusion coefficient. Int. J. Min. Reclam. Environ., 2008, 22(1), 60-69. [http://dx.doi.org/10.1080/17480930701474869] |
| [6] | Xu, G.; Jong, E.C.; Luxbacher, K.D.; Ragab, S.A.; Karmis, M.E. Remote characterization of ventilation systems using tracer gas and CFD in an underground mine. Saf. Sci., 2015, 74, 140-149. [http://dx.doi.org/10.1016/j.ssci.2015.01.004] |
| [7] | Xu, G.; Luxbacher, K.D.; Ragab, S.; Schafrik, S. Development of a remote analysis method for underground ventilation systems using tracer gas and CFD in a simplified laboratory apparatus. Tunn. Undergr. Space Technol., 2013, 33, 1-11. [http://dx.doi.org/10.1016/j.tust.2012.09.001] |
| [8] | Arpa, G.; Widiatmojo, A.; Widodo, N.P.; Sasaki, K. Tracer gas measurement and simulation of turbulent diffusion in mine ventilation roadways. J. Coal Sci. Eng. (China), 2008, 14(4), 523-529. [http://dx.doi.org/10.1007/s12404-008-0401-x] |
| [9] | Thimons, E.D.; Kissell, F.N. Tracer Gas as an Aid in Mine Ventilation Analysis (No. BM-RI-7917); Bureau of Mines: Washington, DC, USA, 1974. |
| [10] | Grenier, M.G.; Hardcastle, S.G.; Kunchur, G.; Butler, K. The use of tracer gases to determine dust dispersion patterns and ventilation parameters in a mineral processing plant. Am. Ind. Hyg. Assoc. J., 1992, 53(6), 387-394. [http://dx.doi.org/10.1080/15298669291359825] [PMID: 1605111] |
| [11] | Qin, R.X.; Chen, K.; Dai, G.L.; Yu, Y.N. On the air leakage gas tracer test in the 3 -D goals of the coal seam group mining. J. Saf. Environ., 2015, 15(5), 34-38. |
| [12] | Patterson, R.; Luxbacher, K. Tracer gas applications in mining and implications for improved ventilation characterisation. Int. J. Min. Reclam. Environ, 2012, 26(4), 337-350. [http://dx.doi.org/10.1080/17480930.2011.639188] |
| [13] | Wang, H.Q. Theory and application in mine ventilation of tracer gas measurement. Ind. Saf. Dust Control, 2000, 2, 11-13. |
| [14] | Zheng, M.G.; Zeng, X.Y.; Chi, Z.H.; Wang, J.Q. Numerical simulations and experimental study of the mixing uniformity of tracer gas in 90° bend pipe. J. China Univ. Metrol., 2011, 22(4), 332-336. |