- Home
- About Journals
-
Information for Authors/ReviewersEditorial Policies
Publication Fee
Publication Cycle - Process Flowchart
Online Manuscript Submission and Tracking System
Publishing Ethics and Rectitude
Authorship
Author Benefits
Reviewer Guidelines
Guest Editor Guidelines
Peer Review Workflow
Quick Track Option
Copyediting Services
Bentham Open Membership
Bentham Open Advisory Board
Archiving Policies
Fabricating and Stating False Information
Post Publication Discussions and Corrections
Editorial Management
Advertise With Us
Funding Agencies
Rate List
Kudos
General FAQs
Special Fee Waivers and Discounts
- Contact
- Help
- About Us
- Search


The Open Fuels & Energy Science Journal
(Discontinued)
ISSN: 1876-973X ― Volume 11, 2018
Thermal Dissolution of Shenfu Sub-Bituminous Coal Promoted by Lignin
Huihui Wu1, Hengfu Shui1, *, Lei Yang1, Xiaoling Wang1, Chunxiu Pan1, Zhicai Wang1, Zhiping Lei1, Shibiao Ren1, Shigang Kang1, Charles Chunbao Xu1, 2
Abstract
Objective:
Thermal Dissolution (TD) and Co-thermal Dissolution (CTD) of Shenfu (SF) coal and lignin were studied. The effect of temperature on the TD and CTD of SF coal and lignin was discussed.
Method:
The synergistic effect of SF coal and lignin in CTD was probed with the characterization of thermal dissolution soluble fraction by elementary analysis, FTIR and TG determinations.
Result:
The results suggested that TD activity of lignin was higher than that of SF coal. Both SF coal and lignin gave their maximal thermal dissolution yield (TDY) of 57.6 and 82.5%, respectively at 360oC. In CTD of SF coal and lignin process, the experimental values (expressed by EXP) of TDY and Thermal Dissolution Soluble Yield (TSY) were both higher than the corresponding calculated weighted mean values (expressed by CAL) of TDY and TSY obtained from the individual TD of SF coal and lignin, suggesting that there existed a synergistic effect in the CTD of SF coal and lignin. Both TDY and TSY in CTD were enhanced to maximal values at 360oC with (EXP-CAL) values of 3.4 and 7.5%, respectively.
Conclusion:
There were interactions between SF coal and lignin in the CTD process. The pyrolysis of lignin at low temperature may form some intermediates such as phenoxy radicals, and these intermediates can further cause depolymerization of coal, thus promoting the TD of coal.
Article Information

Identifiers and Pagination:
Year: 2018Volume: 11
First Page: 71
Last Page: 80
Publisher Id: TOEFJ-11-71
DOI: 10.2174/1876973X01811010071
Article History:
Received Date: 25/12/2017Revision Received Date: 25/05/2018
Acceptance Date: 29/05/2018
Electronic publication date: 14/06/2018
Collection year: 2018
open-access license: This is an open access article distributed under the terms of the Creative Commons Attribution 4.0 International Public License (CC-BY 4.0), a copy of which is available at: https://creativecommons.org/licenses/by/4.0/legalcode. This license permits unrestricted use, distribution, and reproduction in any medium, provided the original author and source are credited.
* Address correspondence to this author at the Anhui University of Technology, Maanshan City 243002, Anhui Province P.R. China, Tel: +865552311730; E-mails: shhf@ahut.edu.cn; shuihf@sina.com
| Open Peer Review Details | |||
|---|---|---|---|
| Manuscript submitted on 25-12-2017 |
Original Manuscript | Thermal Dissolution of Shenfu Sub-Bituminous Coal Promoted by Lignin | |
1. INTRODUCTION
Due to considerable greenhouse gas emission as well as the increased demands and limited reserves of petroleum, much more attention has been paid to energy security and environment-friendly conversion [1Park, H.J.; Jeon, J.K.; Suh, D.J.; Suh, Y.W.; Heo, H.S.; Park, Y.K. Catalytic vapor cracking for improvement of bio-oil quality. Catal. Surv. Asia, 2011, 15, 161-180.
[http://dx.doi.org/10.1007/s10563-011-9119-7] , 2Shui, H.F.; Cai, Z.Y.; Xu, C. Recent advances in direct coal liquefaction. Energies, 2010, 3, 155-170.
[http://dx.doi.org/10.3390/en3020155] ]. Coal liquefaction is one of the significant ways for alternative transportation fuels production, especially in China, which is abundant in low-rank coal reserves while being short of oil resources [3Shui, H.F.; Wang, W.W.; Cai, Z.Y.; Wang, Z.C.; Lei, Z.P.; Ren, S.B.; Pan, C.X.; Li, H.P. Coliquefaction behaviours of Shenhua coal and sawdust catalysed by different catalysts. J. Energy Institute, 2013, 86, 107-112.
[http://dx.doi.org/10.1179/1743967112Z.00000000050] ]. However, the main disadvantages of direct coal liquefaction of low-rank coals are the low yield of liquefied oil and a large amount of the carbon dioxide emissions in this process. Biomass such as lignin is a kind of renewable energy with carbon neutralization. It is one of the promising substitutes for fossil fuels for energy consumption. Co-liquefaction of coal and biomass is one of the effective measures to supply alternative transportation fuels and to decrease the emission of greenhouse gas in the process, because partial substitution of coal by biomass can directly decrease the use of coal, thus decreasing CO2 emission,. therefore, it has been gaining increased research interest [4Zhong, C.; Wei, X. A comparative experimental study on the liquefaction of wood. Energy, 2004, 29, 1731-1741.
[http://dx.doi.org/10.1016/j.energy.2004.03.096] -6Qian, Y.; Zuo, C.; Jian, T.; He, J. Structural analysis of bio-oils from sub-and supercritical water liquefaction of woody biomass. Energy, 2007, 32, 196-202.
[http://dx.doi.org/10.1016/j.energy.2006.03.027] ]. Co-liquefaction of coal and biomass can also give a great effect on the yields and quality improvement for the liquid products, and promote coal liquefaction under milder conditions [7Shui, H.F.; Shan, C.J.; Cai, Z.Y.; Wang, Z.C.; Lei, Z.P.; Ren, S.B.; Pan, C.X.; Li, H.P. Co-liquefaction behavior of a sub-bituminous coal and sawdust. Energy, 2011, 38, 6645-6650.
[http://dx.doi.org/10.1016/j.energy.2011.08.046] -9Stiller, A.H.; Dadyburjor, D.B.; Wan, J.P.; Tian, D.C.; Zondlo, J.W. Co-processing of agricultural and biomass waste with coal. Fuel Process. Technol., 1996, 49, 167-175.
[http://dx.doi.org/10.1016/S0378-3820(96)01051-X] ]. In our previous researches, several potential uses of thermal dissolution soluble fractions have been found: Firstly, the thermal dissolution soluble fractions from sub-bituminous coal and lignite show a higher liquefaction activity compared to the corresponding raw coal under the same conditions. Secondly, the catalyst used in the liquefaction of thermal dissolution soluble fraction is reusable. Moreover, the yield of oil achieved from liquefaction of thermal dissolution soluble fraction is relatively high (>70 wt %) [10Shui, H.F.; Zhu, W.W.; Wang, W.W.; Pan, C.X.; Wang, Z.C.; Lei, Z.P.; Ren, S.B.; Kang, S.G. Thermal dissolution of lignite and liquefaction behaviors of its thermal dissolution soluble fractions. Fuel, 2015, 139, 516-522.
[http://dx.doi.org/10.1016/j.fuel.2014.08.070] , 11Shui, H.F.; Yang, L.; Shui, T.; Pan, C.X.; Li, H.P.; Wang, Z.C.; Lei, Z.P.; Ren, S.B.; Kang, S.G. Hydro-liquefaction of thermal dissolution soluble fraction of Shenfu subbituminous coal and reusability of catalyst on the hydro-liquefaction. Fuel, 2014, 115, 227-231.
[http://dx.doi.org/10.1016/j.fuel.2013.07.002] ]. Thus, a new pathway can be raised to commercial high-efficiency liquefaction of coal in the industry.
Based on the liquefaction mechanism, lignin was firstly depolymerized into several substituted phenoxyl radicals at 300°C. The phenoxyl radicals then resulted in depolymerization of coal, thus promoting the liquefaction of coal [12Coughlin, R.W.; Davoudzadeh, F. Coliquefaction of lignin and bituminous coal. Fuel, 1986, 65, 95-106.
[http://dx.doi.org/10.1016/0016-2361(86)90148-1] , 13Guo, Z.X.; Bai, Z.Q.; Bai, J.; Wang, Z.Q.; Li, W. Co-liquefaction of lignite and sawdust under syngas. Fuel Process. Technol., 2011, 92, 119-125.
[http://dx.doi.org/10.1016/j.fuproc.2010.09.014] ]. It can also be considered that Co-thermal Dissolution (CTD) of coal and lignin will promote Thermal Dissolution (TD) of coal through the generation of phenoxyl radicals from the thermolysis of lignin at low temperature. Furthermore, as a biomass, CTD of coal and lignin also shows the potential reduction of carbon dioxide emissions as compared to the TD of coal.
In this paper, we have studied the CTD behavior of SF coal and lignin. We speculate that the TD of SF coal can be promoted by the addition of lignin at mild temperatures and the yield of the thermal dissolution soluble fraction in the CTD should be increased.
2. EXPERIMENTAL
2.1. Raw Materials
A Chinese sub-bituminous coal, i.e. SF coal and industrial lignin were used in this study. The proximate and ultimate analyses results are shown in (Table 1).
2.2. Thermal Dissolution
TD was conducted at a flow-type extractor, and the descriptions of the general TD process in details are shown elsewhere [14Shui, H.F.; Hui, Z.; Jiang, Q.Q.; Zhou, H.; Pan, C.X.; Wang, Z.C.; Lei, Z.P.; Ren, S.B.; Kang, S.G. Co-thermal dissolution of Shenmu-Fugu subbituminous coal and sawdust. Fuel Process. Technol., 2015, 131, 87-92.
[http://dx.doi.org/10.1016/j.fuproc.2014.11.017] , 15Shui, H.F.; Zhou, Y.; Li, H.P.; Wang, Z.C.; Lei, Z.P.; Ren, S.B.; Pan, C.X.; Wang, W.W. Thermal dissolution of Shenfu coal in different solvents. Fuel, 2013, 108, 385-390.
[http://dx.doi.org/10.1016/j.fuel.2012.11.005] ]. In order to thermally dissolve the feedstock, about 0.15 g of SF coal or lignin or the mixture of SF coal and lignin (1:1 in weight) in CTD was charged into a stainless steel tuber cell. The cell was sandwiched between a pair of sintered stainless steel filter plates (average pore size, 0.5 μm) on both sides. 1-methylnaphthalene (1–MN) then flowed through the cell at a rate of 1ml/min at the required temperature for 1.5 h to thermally dissolve the material in the cell. After the TD process finished, the residual solid left in the cell was referred to as TD insoluble fraction. An excess of n-hexane was finally added to the TD solution for thermal dissolution soluble fraction precipitation purpose. Therefore, the raw material was divided into three parts, i.e. the gas produced in TD, the thermal dissolution soluble fraction and TD insoluble fraction. The Thermal Dissolution Yield (TDY) was calculated by Eq. (1) based on the weight of TD insoluble fraction. The Thermal Dissolution Soluble Yield (TSY) was calculated by Eq. (2) based on the weight of thermal dissolution soluble fraction.
 |
(1) |
 |
(2) |
where m1 (g), m2 (g), m3 (g), and Ad (wt %, db) are the initial masses of the raw materials, TD insoluble fraction, the thermal dissolution soluble fraction, and the ash content of the raw material, respectively. The TD and CTD of SF coal and lignin were duplicated, and the experimental error of two parallel tests was within 5%. The results reported in this study were the mean values of the two parallel runs.
2.3. Characterization of a Thermal Dissolution Soluble Fraction
The elemental analysis was measured with an Elementar Vario EL III elemental analyzer. All elemental analyses were duplicated, and the experimental error was within 2%.
FTIR was measured by a NICOLET6700 FT-IR spectrometer with a resolution of 4 cm-1. 1 mg of sample was mixed with 100 mg of KBr and then was formed into a pellet for the FTIR measurement.
The synchronous fluorescence spectrum was performed at a Hitachi F-4600 spectrophotometer. The thermal dissolution soluble fraction was diluted in tetrahydrofuran to a concentration of 5 mg/l and placed in a quartz cell of 1 cm path length. A 150W xenon lamp was used as the excitation source. Emission and excitation wavelength difference was 13 nm. The spectrum was scanned from 200 to 900 nm at a speed of 240 nm/min.
Thermogravimetric (TG) analysis was carried out on an STA-449-F3 Jupiter analyzer. About 10 mg of sample was placed in an alumina pan and heated from 25 to 900oC at a rate of 10oC /min. The argon gas flow rate was 50 ml/min.
3. RESULTS AND DISCUSSION
3.1. Pyrolysis of SF Coal and Lignin
Fig. (1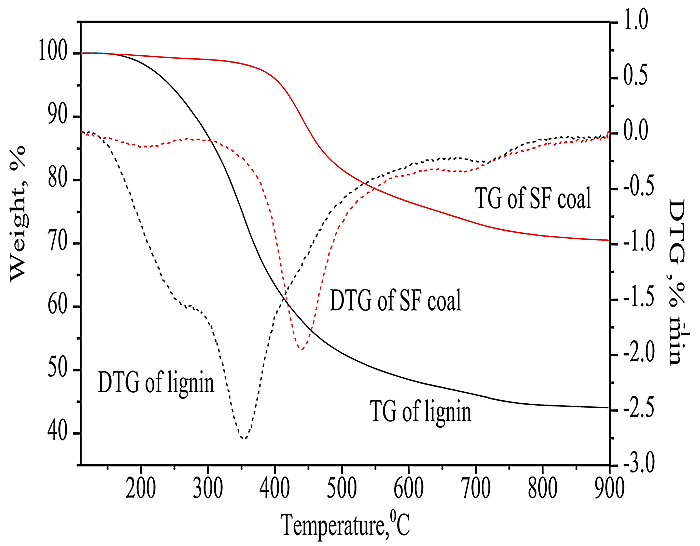 ) compares the TG and DTG results of SF coal and lignin. The weight loss rate of lignin was about 55 wt% in the whole studied temperature range, which is much higher than that of SF coal of 29 wt%. If not taking the removal of moisture into account, the TG curve of lignin can be divided into three regions by different slopes. These regions can be attributed to the decompositions of hemicelluloses, cellulose, and lignin [16Haykiri-Acma, H.; Yaman, S. Synergy in devolatilization characteristics of lignite and hazelnut shell during co-pyrolysis. Fuel, 2007, 86, 373-380.
[http://dx.doi.org/10.1016/j.fuel.2006.07.005] ]. It can be observed that the initial pyrolysis temperature of lignin was about 200oC from TG curve using tangent line method according to the literature [17Yan, W.P.; Chen, Y.Y. Experimental study on co-pyrolysis characteristics of lignite mixed with biomass mixture. J Power Eng., 2006, 26, 865-893.], and the maximum rate of weight loss was obtained at about 350oC as shown in DTG curve. A shoulder peak at about 250oC near the peak of the maximum rate of weight loss could be observed from the DTG curve of lignin. The shoulder and the maximum rate of weight loss peaks can be attributed to the hemicelluloses and cellulose decompositions, respectively according to the literature [18Garcia-Perez, M.; Chaala, A.; Yang, J.; Roy, C. Co-pyrolysis of sugarcane bagasse with petroleum residue – part I: Thermogravimetric analysis. Fuel, 2001, 80, 1245-1258.
[http://dx.doi.org/10.1016/S0016-2361(00)00215-5] ], and the peak corresponding to lignin was completely overlapped by the two peaks. After completion of this rapid devolatilization region up to about 550oC, several slow devolatilization regions were taken up to 900oC. This is in accordance with the low fixed carbon, ash and high volatile matter contents of lignin.
 |
Fig. (1) TG/DTG curves of SF coal and lignin. |
The initial pyrolysis temperature of SF coal was about 370oC, and the temperature of the maximum rate of weight loss was about 440oC. Rapid devolatilization region continued up to 550oC, and then slow devolatilization took place till 900oC. This is also in accordance with the contents of fixed carbon and ash in SF coal. Fig. (1) shows that both the initial pyrolysis temperature and the maximal rate of weight loss temperature of SF coal were much higher than those of lignin, respectively. The maximal weight loss rate of 1.9%/min for SF coal was lower than that of 2.8%/min for lignin as shown in the DTG curves. The results suggest that lignin is easier to be pyrolyzed compared to SF coal.
3.2. Individual TD of SF Coal and Lignin
Fig. (2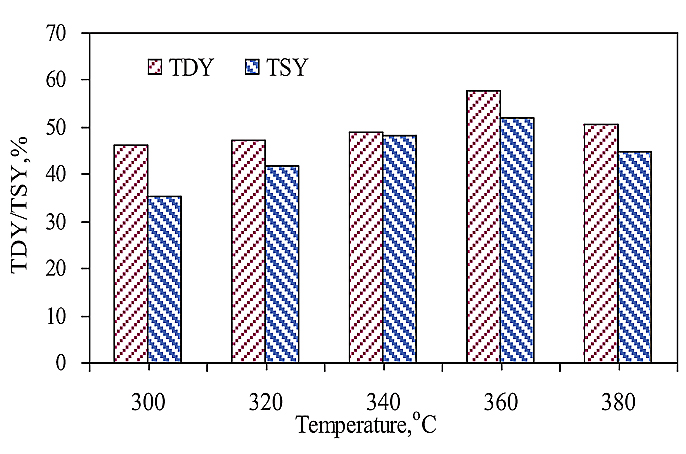 ) shows the TD results of SF coal at different temperatures. With the TD temperature rising, both TDY and TSY increased to 360oC and then decreased when the TD temperature further increased to 380oC. The maximal TDY and TSY were 57.6 and 52.1%, respectively at 360oC. The pyrolysis of SF coal may take place at 380oC as indicated by TG above, thus causing the condensation reaction to take place rigorously, resulting in a decrease in both TDY and TSY. TDYs at all temperatures were higher than the corresponding TSYs, suggesting that a certain amount of gas was produced at the TD of SF coal process. The (TDY-TSY) difference got to minimal value at 340oC.
 |
Fig. (2) TD of SF coal at different temperature. |
Fig. (3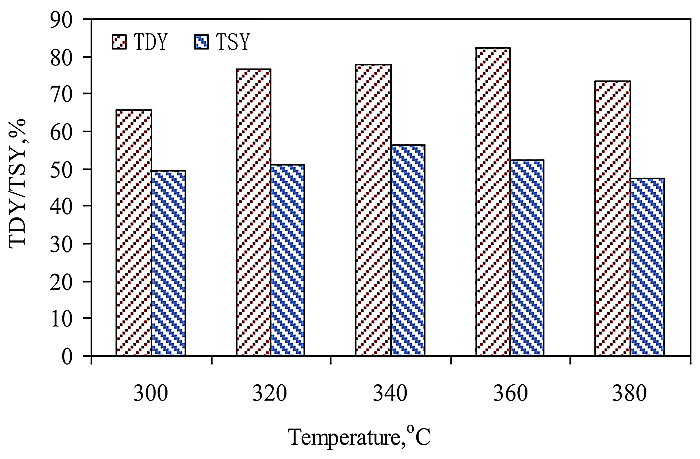 ) shows the TD results of lignin at different temperatures. The TDY reached the maximal value of 82.5% at 360oC. The TSY gave its maximal value of 56.2% at 340oC. However, SF coal gave both maximal TDY and TSY at 360oC mentioned above. Further raising the TD temperature to 380oC, both TDY and TSY decreased due to condensation reactions. Lignin gave higher TDYs and (TDY-TSY) differences than SF coal at the same temperature, suggesting that the TD activity of lignin was higher than that of SF coal and more gases were produced in the TD of lignin. This result is in accordance with the TG/DTG result mentioned above.
 |
Fig. (3) TD of lignin at different temperatures. |
3.3. CTD of SF Coal and Lignin
Table 2 shows the effect of SF coal/lignin mixing ratio on the CTD results at 360oC in a 1-MN solvent. For comparison, TDY and TSY from individual TD of lignin and SF coal are also presented in Table 2. It can be observed that with decreasing amount of lignin in the mixture, both TDY and TSY decreased. The mixing ratio of SF coal/lignin increased from 1:1 to 2:1, the TDY and TSY decreased from 73.8 to 64.9% and 59.6 to 55.7%, respectively as shown in Table 2. It is interesting that the TSY gave the maximal value of 59.6% at 1:1 of SF coal/lignin mixing ratio and this value was higher than the TSY of single TD of lignin or SF coal. In the TD products, the thermal dissolution soluble fraction should be the most valuable and preferable product. Therefore, in the CTD of SF coal and lignin, the mixing ratio of SF coal/lignin as 1:1 in weight was chosen in this study.
Fig. (4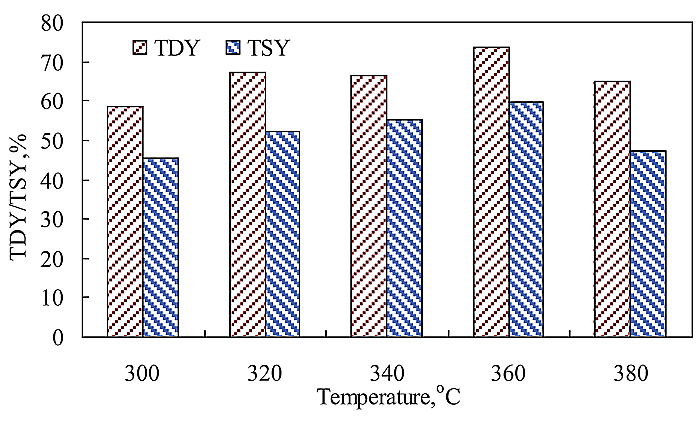 ) shows the CTD results of SF coal and lignin at a mixing ratio of 1:1 in weight. The changes of TDY and TSY with TD temperature in CTD are same as those in single TD of SF coal. With CTD temperature rising from 300 to 360oC, both TDY and TSY increased. The maximal values of TDY and TSY were achieved at 360oC, which were 73.8 and 59.6%, respectively. The difference of TDY-TSY gave the minimum value of 11.3% at 340oC. Assuming that there are no synergistic interactions between SF coal and lignin in the CTD, the TDY and TSY in CTD should be equal to the corresponding calculated weighted mean values from the individual TD of SF coal and lignin. For simplicity, the calculated weighted mean value was defined as CAL value, and the experimental value was defined as EXP value hereafter. Fig. (5
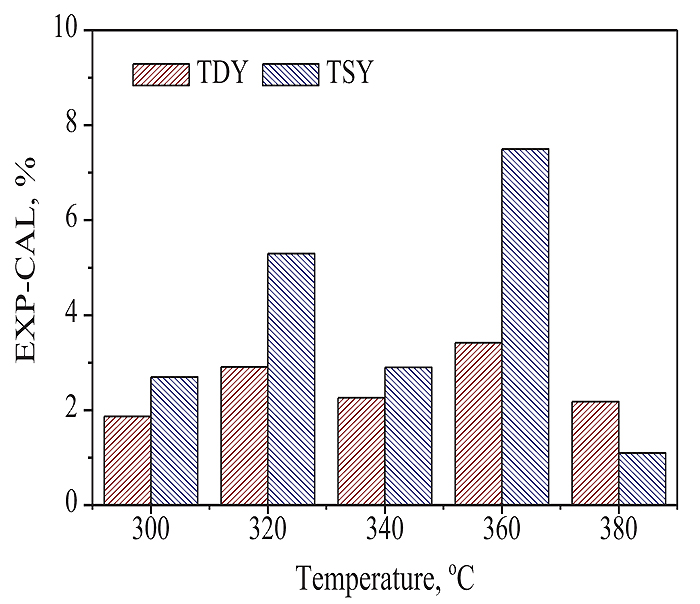 ) shows the (EXP-CAL) value differences of TDY and TSY at different temperatures. If the difference of EXP-CAL is equal to 0, it may suggest that there is no interaction between SF coal and lignin in the CTD. As shown in Fig. (5), the experimental values (EXPs) for both TDY and TSY were higher than the corresponding calculated values (CALs), at all CTD temperatures, suggesting that in the CTD of SF coal and lignin, there actually existed synergistic effect, resulting in increases of the EXP values of TDY and TSY compared to the corresponding CAL values. The free radicals or intermediates formed from the pyrolysis of lignin may be responsible for the synergistic effect [7Shui, H.F.; Shan, C.J.; Cai, Z.Y.; Wang, Z.C.; Lei, Z.P.; Ren, S.B.; Pan, C.X.; Li, H.P. Co-liquefaction behavior of a sub-bituminous coal and sawdust. Energy, 2011, 38, 6645-6650.
[http://dx.doi.org/10.1016/j.energy.2011.08.046] , 14Shui, H.F.; Hui, Z.; Jiang, Q.Q.; Zhou, H.; Pan, C.X.; Wang, Z.C.; Lei, Z.P.; Ren, S.B.; Kang, S.G. Co-thermal dissolution of Shenmu-Fugu subbituminous coal and sawdust. Fuel Process. Technol., 2015, 131, 87-92.
[http://dx.doi.org/10.1016/j.fuproc.2014.11.017] ]. Both TDY and TSY were promoted to maximal values at 360oC with (EXP-CAL) values of 3.4 and 7.5%, respectively. The promoted values of TDY and TSY at 320oC were larger than the corresponding values at 300 or 340oC. This may suggest that the synergistic effect is affected by TD temperature, and the free radicals or intermediates formed from pyrolysis of lignin at 320oC are more effective to promote depolymerization and hydrogenation of SF coal. It is interesting that at CTD temperature from 300 - 360oC, the (EXP-CAL) values of TSY are all higher than those of TDY at the same temperature. This may suggest that the synergistic effect between SF coal and lignin in the CTD is more preferable to promote the formation of thermal dissolution soluble fractions, thus resulting in the additional enhancement of TSY.
 |
Fig. (4) CTD of SF coal and lignin at different temperature. |
 |
Fig. (5) (EXP-CAL) of TDY and TSY at different temperatures. |
3.4. Characterization of the Thermal Dissolution Soluble Fraction
Tables 3 and 4 show the elemental compositions of the thermal dissolution soluble fractions of SF coal and lignin obtained at different temperatures, respectively. For thermal dissolution soluble fractions of SF coal, with the TD temperature rising from 320 to 360oC, C% increased and O% decreased. However, further raising the TD temperature to 380oC, C% decreased and O% increased. The TSY and TDY of SF coal achieved maximal values at 360oC as mentioned above. This may suggest that the condensation reactions at high TD temperature may easily take place within the oxygen functional groups, resulting in the decrease of O% in the thermal dissolution soluble fraction obtained at 380oC. As the lignin contained more oxygen and less carbon than SF coal as shown in Table 1, therefore, the O% was much higher and C% was lower in the thermal dissolution soluble fractions from lignin compared to those from SF coal. Both (EXP-CAL) values of TDY and TSY gave the maximum at 360oC as shown in Fig. (4). Table 4 shows the comparison of elemental compositions of CAL and EXP values for the thermal dissolution soluble fraction obtained from the CTD at 360oC. It can be observed that O% of EXP value was much lower than that of CAL value, suggesting that more parts of thermal dissolution soluble fraction came from SF coal due to the synergistic effect. This may demonstrate that depolymerization of lignin in CTD promotes the TD of SF coal.
Fig. (6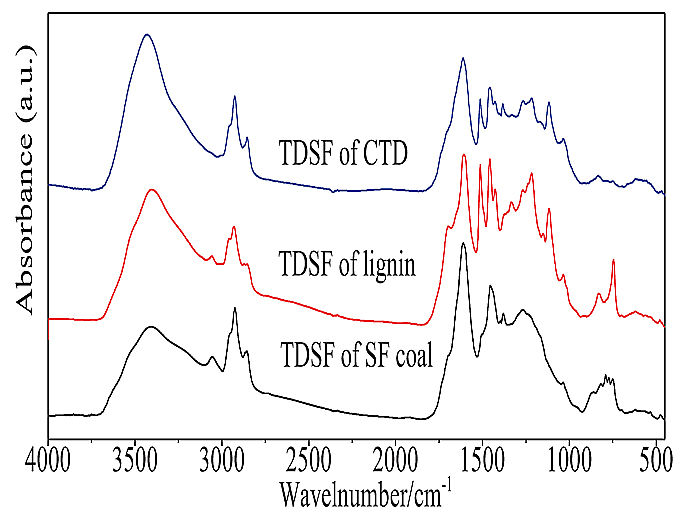 ) shows the FTIR spectra of the thermal dissolution soluble fractions from single TD of SF coal and lignin and their CTD at 360oC. The intensity of the band at 1680 cm-1, which is attributed to carbonyl C=O in the thermal dissolution soluble fraction from CTD decreased when compared with the thermal dissolution soluble fraction from TD of lignin, suggests that the most parts of the thermal dissolution soluble fraction in CTD were from SF coal. The band at 1510 cm-1, which is attributed to CH2- stretching obviously appeared in the thermal dissolution soluble fraction from CTD, and also this band could be clearly observed in the thermal dissolution soluble fraction from TD of lignin, suggesting that a certain amount of thermal dissolution soluble fraction in CTD was from lignin. The adsorption peak at 3030 cm−1, which is attributed to aromatic C-H stretching [19Cai, M.F.; Smart, R.B. Comparison of seven west Virginia coals with their N-methyl-2-pyrrolidinone-soluble extracts and residues. 1. Diffuse reflectance infrared Fourier transform spectroscopy. Energy Fuels, 1994, 8, 369-374.
[http://dx.doi.org/10.1021/ef00044a012] ] almost disappeared in the thermal dissolution soluble fraction from CTD, and this was also observed in the decreased intensities of bands of 750−900 cm−1, which are attributed to the aromatic out-of-plane CH bending bands [20Dyrkacz, R.A.; Bloomquist, C.A.A. On the use of infrared spectroscopy to determine hydroxyl content and reactivity of O-acetylated and O-alkylated coals. Energy Fuels, 1999, 13, 40-52.
[http://dx.doi.org/10.1021/ef980062z] ] in the thermal dissolution soluble fraction from CTD, suggesting that thermal dissolution soluble fraction from CTD contained less amount of aromatic compounds compared to that from TD of SF coal or lignin. The results may suggest that there exist interactions between coal and lignin in the CTD process, and the interactions promote the TD of SF coal.
 |
Fig. (6) FTIR spectra of thermal dissolution soluble fractions from TD and CTD of SF coal and lignin at 360oC. |
Fig. (7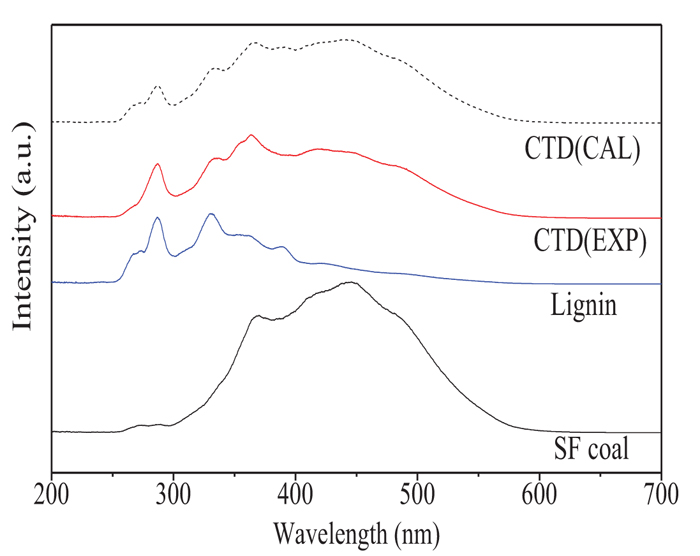 ) shows the synchronous fluorescence spectra of thermal dissolution soluble fractions from TD and CTD of SF coal and lignin at 360oC (expressed by EXP), and the corresponding calculated mean CTD spectrum based on the individual spectrum of thermal dissolution soluble fraction from TD of SF coal and lignin at 360oC (expressed by CAL). In general, the polyaromatic hydrocarbons (PAHs) with a different number of rings have different fluorescing properties. According to the literature [21Benkhedda, Z.; Landais, P.; Kister, J.; Dereppe, J.M.; Monthioux, M. Spectroscopic analyses of aromatic hydrocarbons extracted from naturally and artificially matured coals. Energy Fuels, 1992, 6, 166-172.
[http://dx.doi.org/10.1021/ef00032a008] , 22Wang, Z.C.; Wei, C.; Shui, H.F.; Ren, S.B.; Pan, C.X.; Wang, Z.S.; Li, H.P.; Lei, Z.P. Synchronous fluorimetric characterization of heavy intermediates of coal direct liquefaction. Fuel, 2012, 98, 67-72.
[http://dx.doi.org/10.1016/j.fuel.2012.03.046] ], in this study, the synchronous fluorescence spectrum peaks at 280-300 nm, 300-340 nm, 340–400 nm, and more than 400 nm are attributed to the PAHs containing 1, 2, 3, and 4~ rings, respectively. It can be observed from Fig. (7) that the thermal dissolution soluble fraction obtained from TD of SF coal at 360oC was mainly composed of 3, 4 and more than 4 rings PAHs, but the PAHs in thermal dissolution soluble fraction from lignin mainly consisted of 1 and 2 rings. If there are no interactions in the CTD of SF coal and lignin, the synchronous fluorescence spectrum (EXP) of the thermal dissolution soluble fraction obtained from the CTD of SF coal and lignin should be the same as the calculated mean spectrum (CAL) in CTD based on the individual spectrum of thermal dissolution soluble fraction from TD of SF coal and lignin as shown in Fig. (7). Comparing the two spectra of CTD (EXP) and (CAL), it can be observed that the content of more than 4 rings PAHs in the thermal dissolution soluble fraction obtained from the CTD (EXP) of SF coal and lignin is less than that of the calculated CTD (CAL) results. In the meantime, the contents of PAHs with 3 and 4 rings in the thermal dissolution soluble fraction from CTD (EXP) increased. The results suggest that there are some interactions in the CTD of SF coal and lignin, and the pyrolysis of lignin in the lower temperature can promote the depolymerization of coal, especially for the macromolecules of coal with more than 4 rings PAHs, thus resulting in a decrease in the EXP contents of PAHs with more than 4 rings in the thermal dissolution soluble fraction of CTD compared to that of calculated CAL result.
 |
Fig. (7) Synchronous fluorescence spectra of thermal dissolution soluble fractions from TD and CTD (EXP) of SF coal and lignin at 360oC and the calculated CTD (CAL) spectrum. |
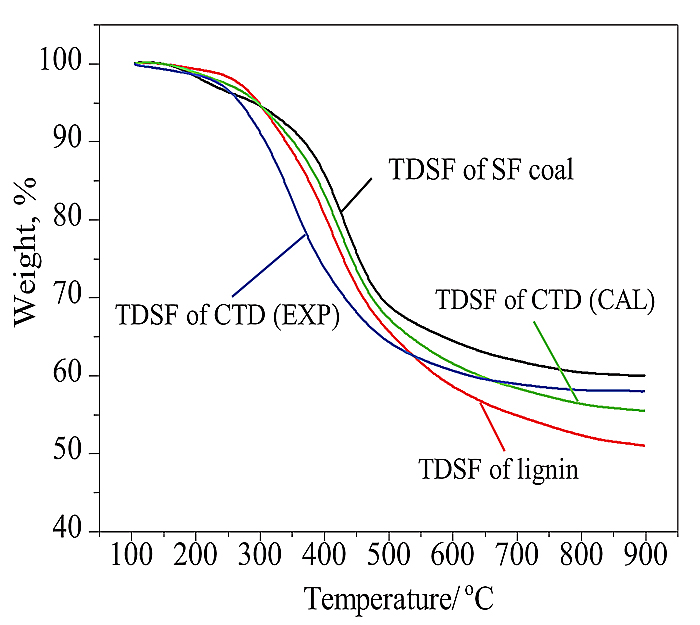 |
Fig. (8) TG curves of thermal dissolution soluble fractions from TD and CTD of SF coal and lignin at 360oC. |
Fig. (8 ) shows the TG curves of the thermal dissolution soluble fractions from TD of SF coal and lignin at 360oC. The TG curves of thermal dissolution soluble fractions from CTD (EXP) and the corresponding calculated mean result (CAL) obtained from the TG curves of thermal dissolution soluble fractions from individual TD of SF coal and lignin are also shown in Fig. (8). The weight losses of the thermal dissolution soluble fraction from TD of lignin were larger than those of thermal dissolution soluble fraction from TD of SF coal after 300oC, and the differences of their weight loss increased obviously especially after 500oC. This may suggest that the thermal dissolution soluble fraction of lignin contains more light constituents and is easy to pyrolyze compared to that of SF coal. The TG curve (CAL) fall in between the TG curves of the thermal dissolution soluble fractions from SF coal and lignin. It is very interesting that the weight loss of the thermal dissolution soluble fraction of CTD (EXP) was larger than that of the CAL value before 650oC, and then it gave less weight loss than that of CAL value after 650oC. It should also be noted that weight losses of the thermal dissolution soluble fraction of CTD (EXP) were even larger than those of the thermal dissolution soluble fraction of lignin before 530oC. The results demonstrate that the pyrolysis of lignin at low temperatures may form some intermediates such as phenoxy radicals [12Coughlin, R.W.; Davoudzadeh, F. Coliquefaction of lignin and bituminous coal. Fuel, 1986, 65, 95-106.
[http://dx.doi.org/10.1016/0016-2361(86)90148-1] ], and these intermediates can cause depolymerization of coal, thus promoting the TD of coal. The depolymerization of coal can take place at original thermal dissolution soluble fraction of SF coal as indicated by CTD (EXP) synchronous fluorescence spectrum in Fig. (7), resulting in larger weight loss of a thermal dissolution soluble fraction of CTD (EXP) at low temperatures. The depolymerization of coal can also occur in some heavy compositions, which are original TD insoluble fractions of SF coal, and this causes thermal dissolution soluble fraction of CTD (EXP) to have lower weight loss at high temperatures.
CONCLUSION
Both the SF coal and lignin gave their maximal TDY of 57.6 and 82.5%, respectively at 360°C. The TD activity of lignin was higher than that of SF coal and a greater amount of gases was produced in the TD of lignin.
There existed synergistic effect in the CTD of SF coal and lignin, and the synergistic effect promoted increases of the EXP values of TDY and TSY compared to their corresponding CAL values. Both the TDY and TSY were promoted to maximal values at 360oC with (EXP-CAL) values of 3.4 and 7.5%, respectively. The synergistic effect between SF coal and lignin preferred to promote the formation of a thermal dissolution soluble fraction, resulting in an increase of TSY.
Interactions between SF coal and lignin in the CTD process were observed. The pyrolysis of lignin at low temperatures might form some intermediates such as phenoxy radicals, and these intermediates could cause the depolymerization of coal, thus promoting the TD of coal.
CONSENT FOR PUBLICATION
Not applicable.
CONFLICT OF INTEREST
The authors declare no conflict of interest, financial or otherwise.
ACKNOWLEDGEMENTS
This work was supported by the National Key Research and Development Program of China (Grant 2018YFB0604603), the Natural Scientific Foundation of China (Grants 21476003, 21776001, 21476002, 21476004). This work was subsidized by Anhui Natural Science Foundation (Grant 1608085MB40). Authors are also appreciative of the financial support from the Provincial Innovative Group for Processing & Clean Utilization of Coal Resource.
REFERENCES
| [1] | Park, H.J.; Jeon, J.K.; Suh, D.J.; Suh, Y.W.; Heo, H.S.; Park, Y.K. Catalytic vapor cracking for improvement of bio-oil quality. Catal. Surv. Asia, 2011, 15, 161-180. [http://dx.doi.org/10.1007/s10563-011-9119-7] |
| [2] | Shui, H.F.; Cai, Z.Y.; Xu, C. Recent advances in direct coal liquefaction. Energies, 2010, 3, 155-170. [http://dx.doi.org/10.3390/en3020155] |
| [3] | Shui, H.F.; Wang, W.W.; Cai, Z.Y.; Wang, Z.C.; Lei, Z.P.; Ren, S.B.; Pan, C.X.; Li, H.P. Coliquefaction behaviours of Shenhua coal and sawdust catalysed by different catalysts. J. Energy Institute, 2013, 86, 107-112. [http://dx.doi.org/10.1179/1743967112Z.00000000050] |
| [4] | Zhong, C.; Wei, X. A comparative experimental study on the liquefaction of wood. Energy, 2004, 29, 1731-1741. [http://dx.doi.org/10.1016/j.energy.2004.03.096] |
| [5] | Sawayama, S.; Minowa, T.; Yokoyama, S.Y. Possibility of renewable energy production and CO2 mitigation by thermochemical liquefaction of microalgae. Biomass Bioenergy, 1999, 17, 33-39. [http://dx.doi.org/10.1016/S0961-9534(99)00019-7] |
| [6] | Qian, Y.; Zuo, C.; Jian, T.; He, J. Structural analysis of bio-oils from sub-and supercritical water liquefaction of woody biomass. Energy, 2007, 32, 196-202. [http://dx.doi.org/10.1016/j.energy.2006.03.027] |
| [7] | Shui, H.F.; Shan, C.J.; Cai, Z.Y.; Wang, Z.C.; Lei, Z.P.; Ren, S.B.; Pan, C.X.; Li, H.P. Co-liquefaction behavior of a sub-bituminous coal and sawdust. Energy, 2011, 38, 6645-6650. [http://dx.doi.org/10.1016/j.energy.2011.08.046] |
| [8] | Shui, H.F.; Jiang, Q.Q.; Cai, Z.Y.; Wang, Z.C.; Lei, Z.P.; Ren, S.B.; Pan, C.X.; Li, H.P. Co-liquefaction of rice straw and coal using different catalysts. Fuel, 2013, 109, 9-13. [http://dx.doi.org/10.1016/j.fuel.2012.06.032] |
| [9] | Stiller, A.H.; Dadyburjor, D.B.; Wan, J.P.; Tian, D.C.; Zondlo, J.W. Co-processing of agricultural and biomass waste with coal. Fuel Process. Technol., 1996, 49, 167-175. [http://dx.doi.org/10.1016/S0378-3820(96)01051-X] |
| [10] | Shui, H.F.; Zhu, W.W.; Wang, W.W.; Pan, C.X.; Wang, Z.C.; Lei, Z.P.; Ren, S.B.; Kang, S.G. Thermal dissolution of lignite and liquefaction behaviors of its thermal dissolution soluble fractions. Fuel, 2015, 139, 516-522. [http://dx.doi.org/10.1016/j.fuel.2014.08.070] |
| [11] | Shui, H.F.; Yang, L.; Shui, T.; Pan, C.X.; Li, H.P.; Wang, Z.C.; Lei, Z.P.; Ren, S.B.; Kang, S.G. Hydro-liquefaction of thermal dissolution soluble fraction of Shenfu subbituminous coal and reusability of catalyst on the hydro-liquefaction. Fuel, 2014, 115, 227-231. [http://dx.doi.org/10.1016/j.fuel.2013.07.002] |
| [12] | Coughlin, R.W.; Davoudzadeh, F. Coliquefaction of lignin and bituminous coal. Fuel, 1986, 65, 95-106. [http://dx.doi.org/10.1016/0016-2361(86)90148-1] |
| [13] | Guo, Z.X.; Bai, Z.Q.; Bai, J.; Wang, Z.Q.; Li, W. Co-liquefaction of lignite and sawdust under syngas. Fuel Process. Technol., 2011, 92, 119-125. [http://dx.doi.org/10.1016/j.fuproc.2010.09.014] |
| [14] | Shui, H.F.; Hui, Z.; Jiang, Q.Q.; Zhou, H.; Pan, C.X.; Wang, Z.C.; Lei, Z.P.; Ren, S.B.; Kang, S.G. Co-thermal dissolution of Shenmu-Fugu subbituminous coal and sawdust. Fuel Process. Technol., 2015, 131, 87-92. [http://dx.doi.org/10.1016/j.fuproc.2014.11.017] |
| [15] | Shui, H.F.; Zhou, Y.; Li, H.P.; Wang, Z.C.; Lei, Z.P.; Ren, S.B.; Pan, C.X.; Wang, W.W. Thermal dissolution of Shenfu coal in different solvents. Fuel, 2013, 108, 385-390. [http://dx.doi.org/10.1016/j.fuel.2012.11.005] |
| [16] | Haykiri-Acma, H.; Yaman, S. Synergy in devolatilization characteristics of lignite and hazelnut shell during co-pyrolysis. Fuel, 2007, 86, 373-380. [http://dx.doi.org/10.1016/j.fuel.2006.07.005] |
| [17] | Yan, W.P.; Chen, Y.Y. Experimental study on co-pyrolysis characteristics of lignite mixed with biomass mixture. J Power Eng., 2006, 26, 865-893. |
| [18] | Garcia-Perez, M.; Chaala, A.; Yang, J.; Roy, C. Co-pyrolysis of sugarcane bagasse with petroleum residue – part I: Thermogravimetric analysis. Fuel, 2001, 80, 1245-1258. [http://dx.doi.org/10.1016/S0016-2361(00)00215-5] |
| [19] | Cai, M.F.; Smart, R.B. Comparison of seven west Virginia coals with their N-methyl-2-pyrrolidinone-soluble extracts and residues. 1. Diffuse reflectance infrared Fourier transform spectroscopy. Energy Fuels, 1994, 8, 369-374. [http://dx.doi.org/10.1021/ef00044a012] |
| [20] | Dyrkacz, R.A.; Bloomquist, C.A.A. On the use of infrared spectroscopy to determine hydroxyl content and reactivity of O-acetylated and O-alkylated coals. Energy Fuels, 1999, 13, 40-52. [http://dx.doi.org/10.1021/ef980062z] |
| [21] | Benkhedda, Z.; Landais, P.; Kister, J.; Dereppe, J.M.; Monthioux, M. Spectroscopic analyses of aromatic hydrocarbons extracted from naturally and artificially matured coals. Energy Fuels, 1992, 6, 166-172. [http://dx.doi.org/10.1021/ef00032a008] |
| [22] | Wang, Z.C.; Wei, C.; Shui, H.F.; Ren, S.B.; Pan, C.X.; Wang, Z.S.; Li, H.P.; Lei, Z.P. Synchronous fluorimetric characterization of heavy intermediates of coal direct liquefaction. Fuel, 2012, 98, 67-72. [http://dx.doi.org/10.1016/j.fuel.2012.03.046] |